
FDIC Quarterly Banking Profile Fourth Quarter 2024
Today, the FDIC is releasing the full-year and fourth quarter 2024 performance results for FDIC-insured institutions.
The banking industry finished the year with strong earnings, resulting in a return on assets ratio of 1.12 percent for the full year. Domestic deposit growth was higher in 2024 than in 2023, while loan growth remained modest in the elevated-rate environment. Asset quality metrics remained favorable overall despite continued weakness in certain portfolios, which we are monitoring closely.
With strong capital and liquidity levels to support lending and protect against potential losses, the banking industry continued to support the country’s needs for financial services while navigating the challenges presented by elevated unrealized losses, asset quality weakness in certain portfolios, and volatility in market interest rates.
Chart 1:
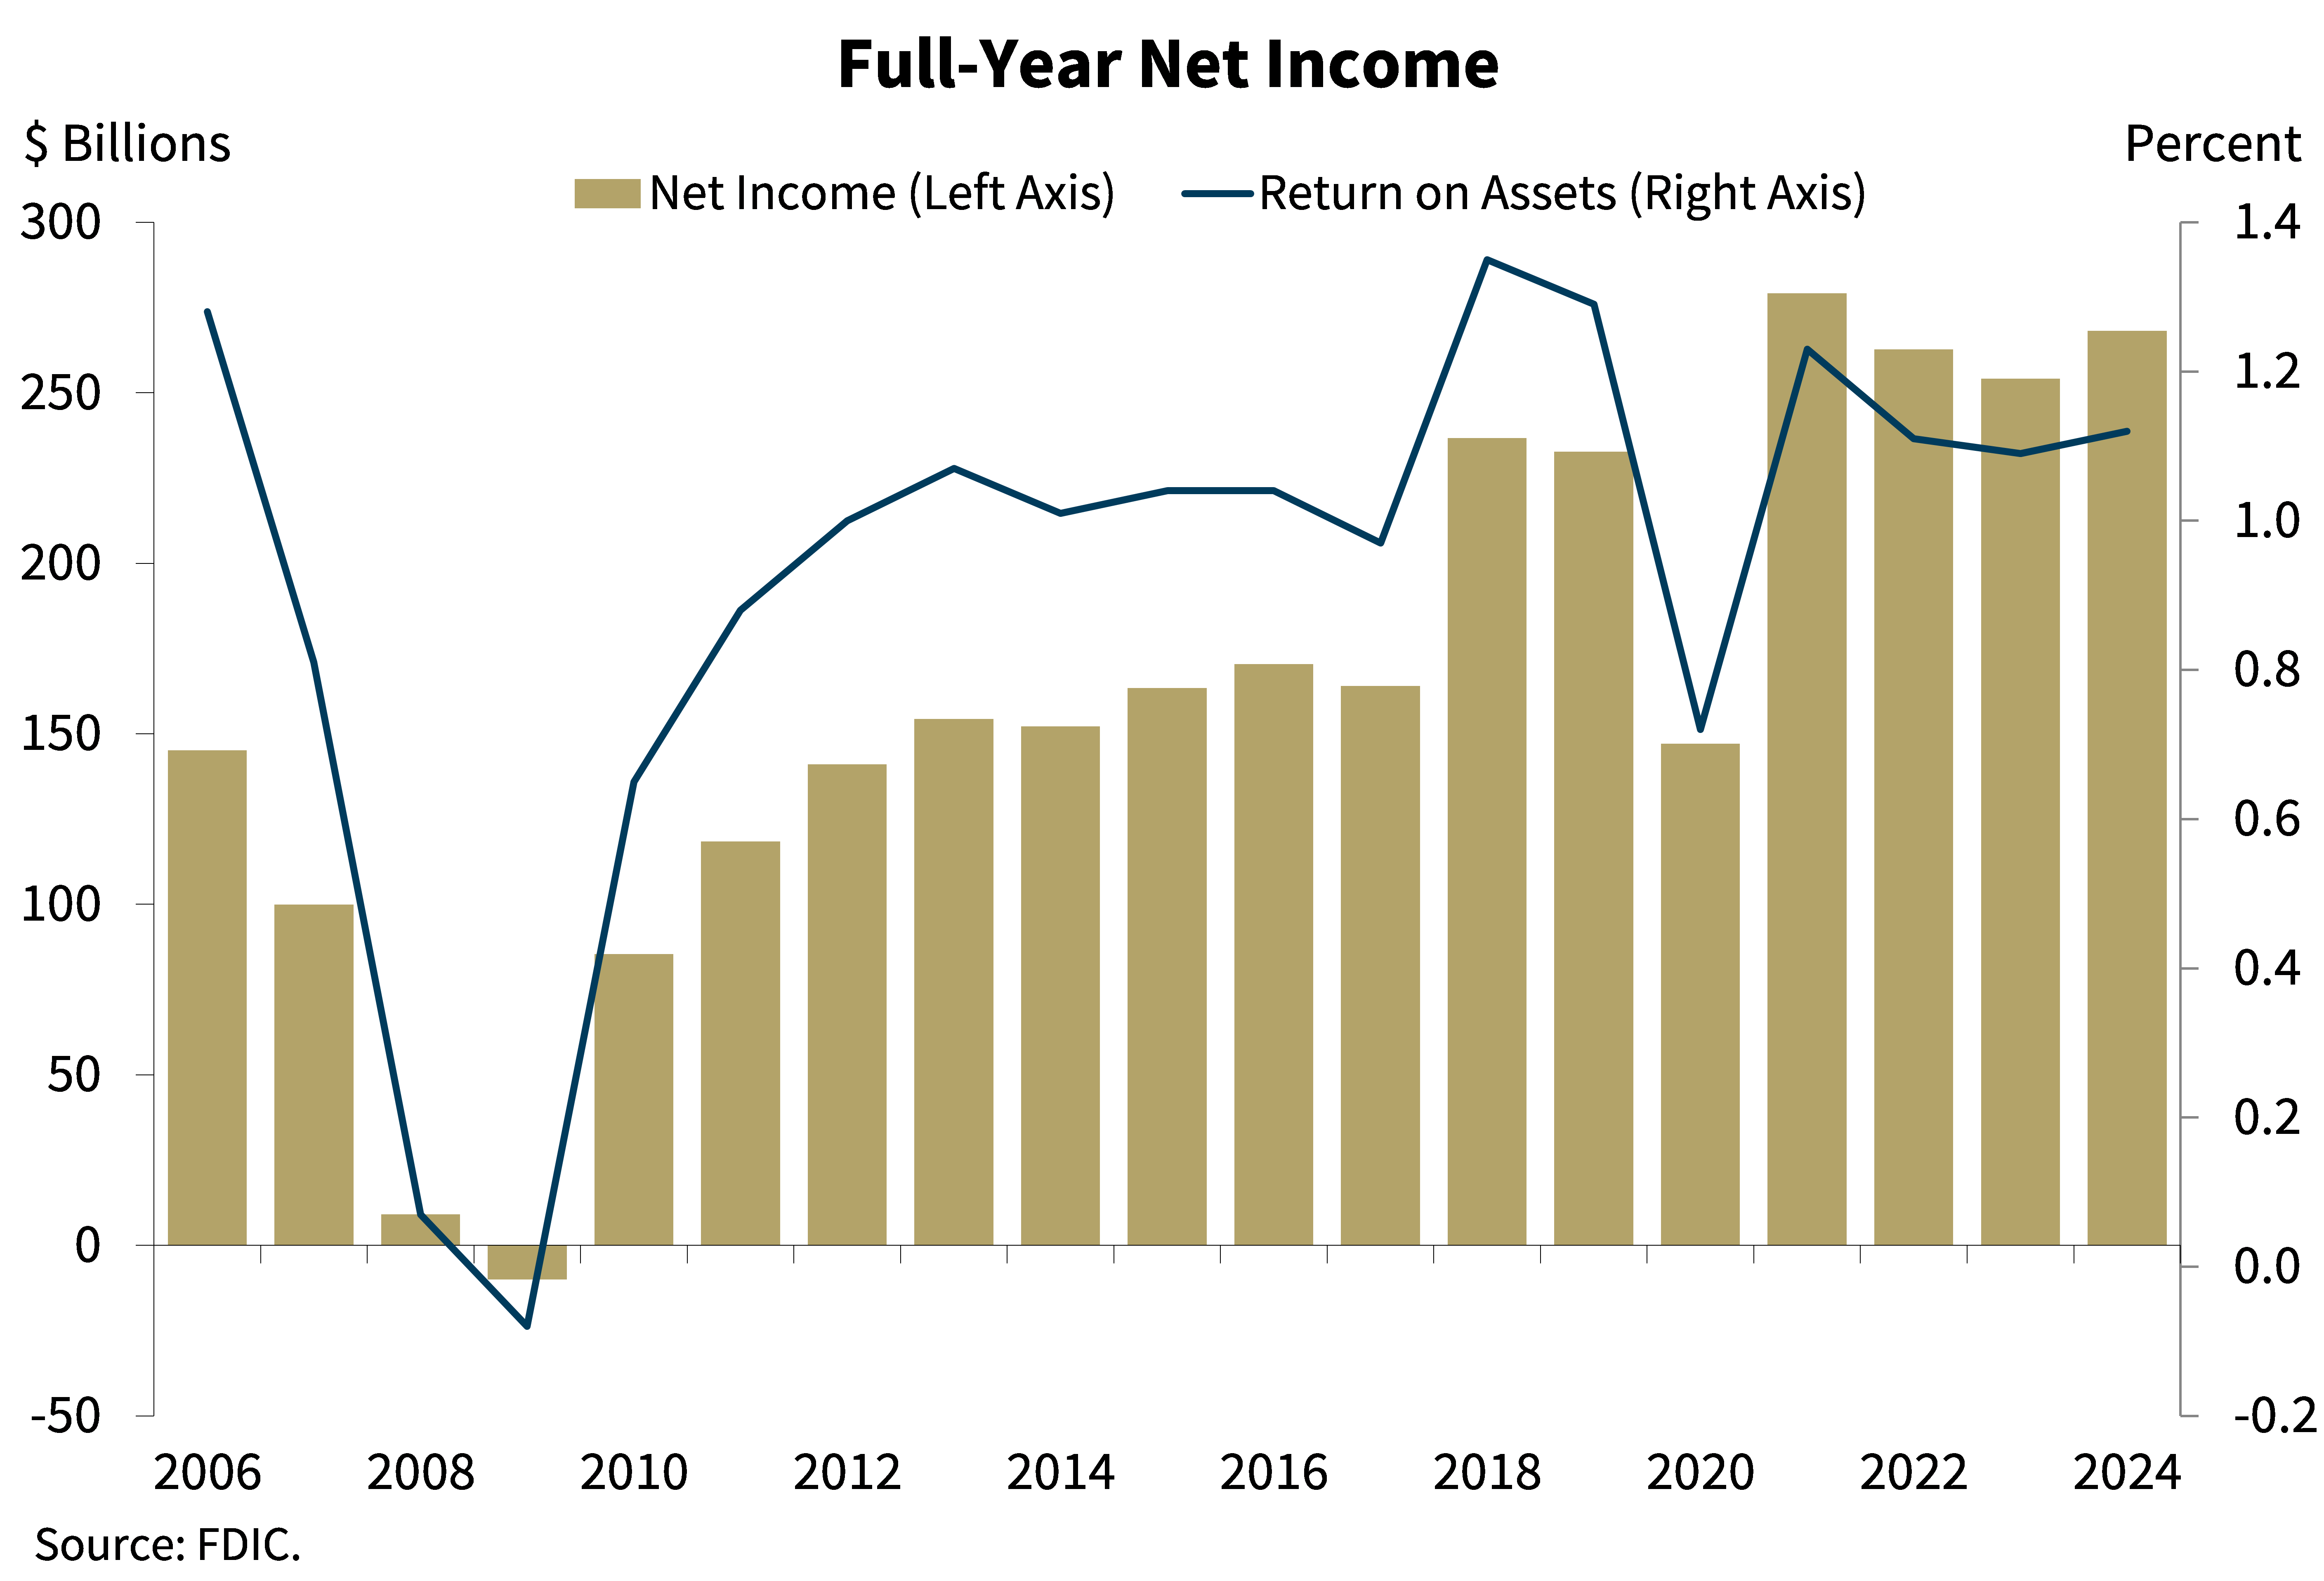
As shown in this chart, full-year 2024 banking industry net income increased from 2023. Net income totaled $268.2 billion in 2024, up 5.6 percent from 2023. The annual increase was driven by lower interest expense, higher noninterest income, and lower realized losses on the sale of securities. The industry’s return on assets ratio increased 3 basis points to 1.12 percent, and 6.7 percent of banks were unprofitable during the year.
Community banks reported annual net income of $25.9 billion, down 2.4 percent from the prior year. The decrease in community bank net income was primarily attributable to higher noninterest expense and higher provision expense. Community banks reported a pre-tax return on assets ratio of 1.14 percent in 2024, down 8 basis points from 2023.
Chart 2:
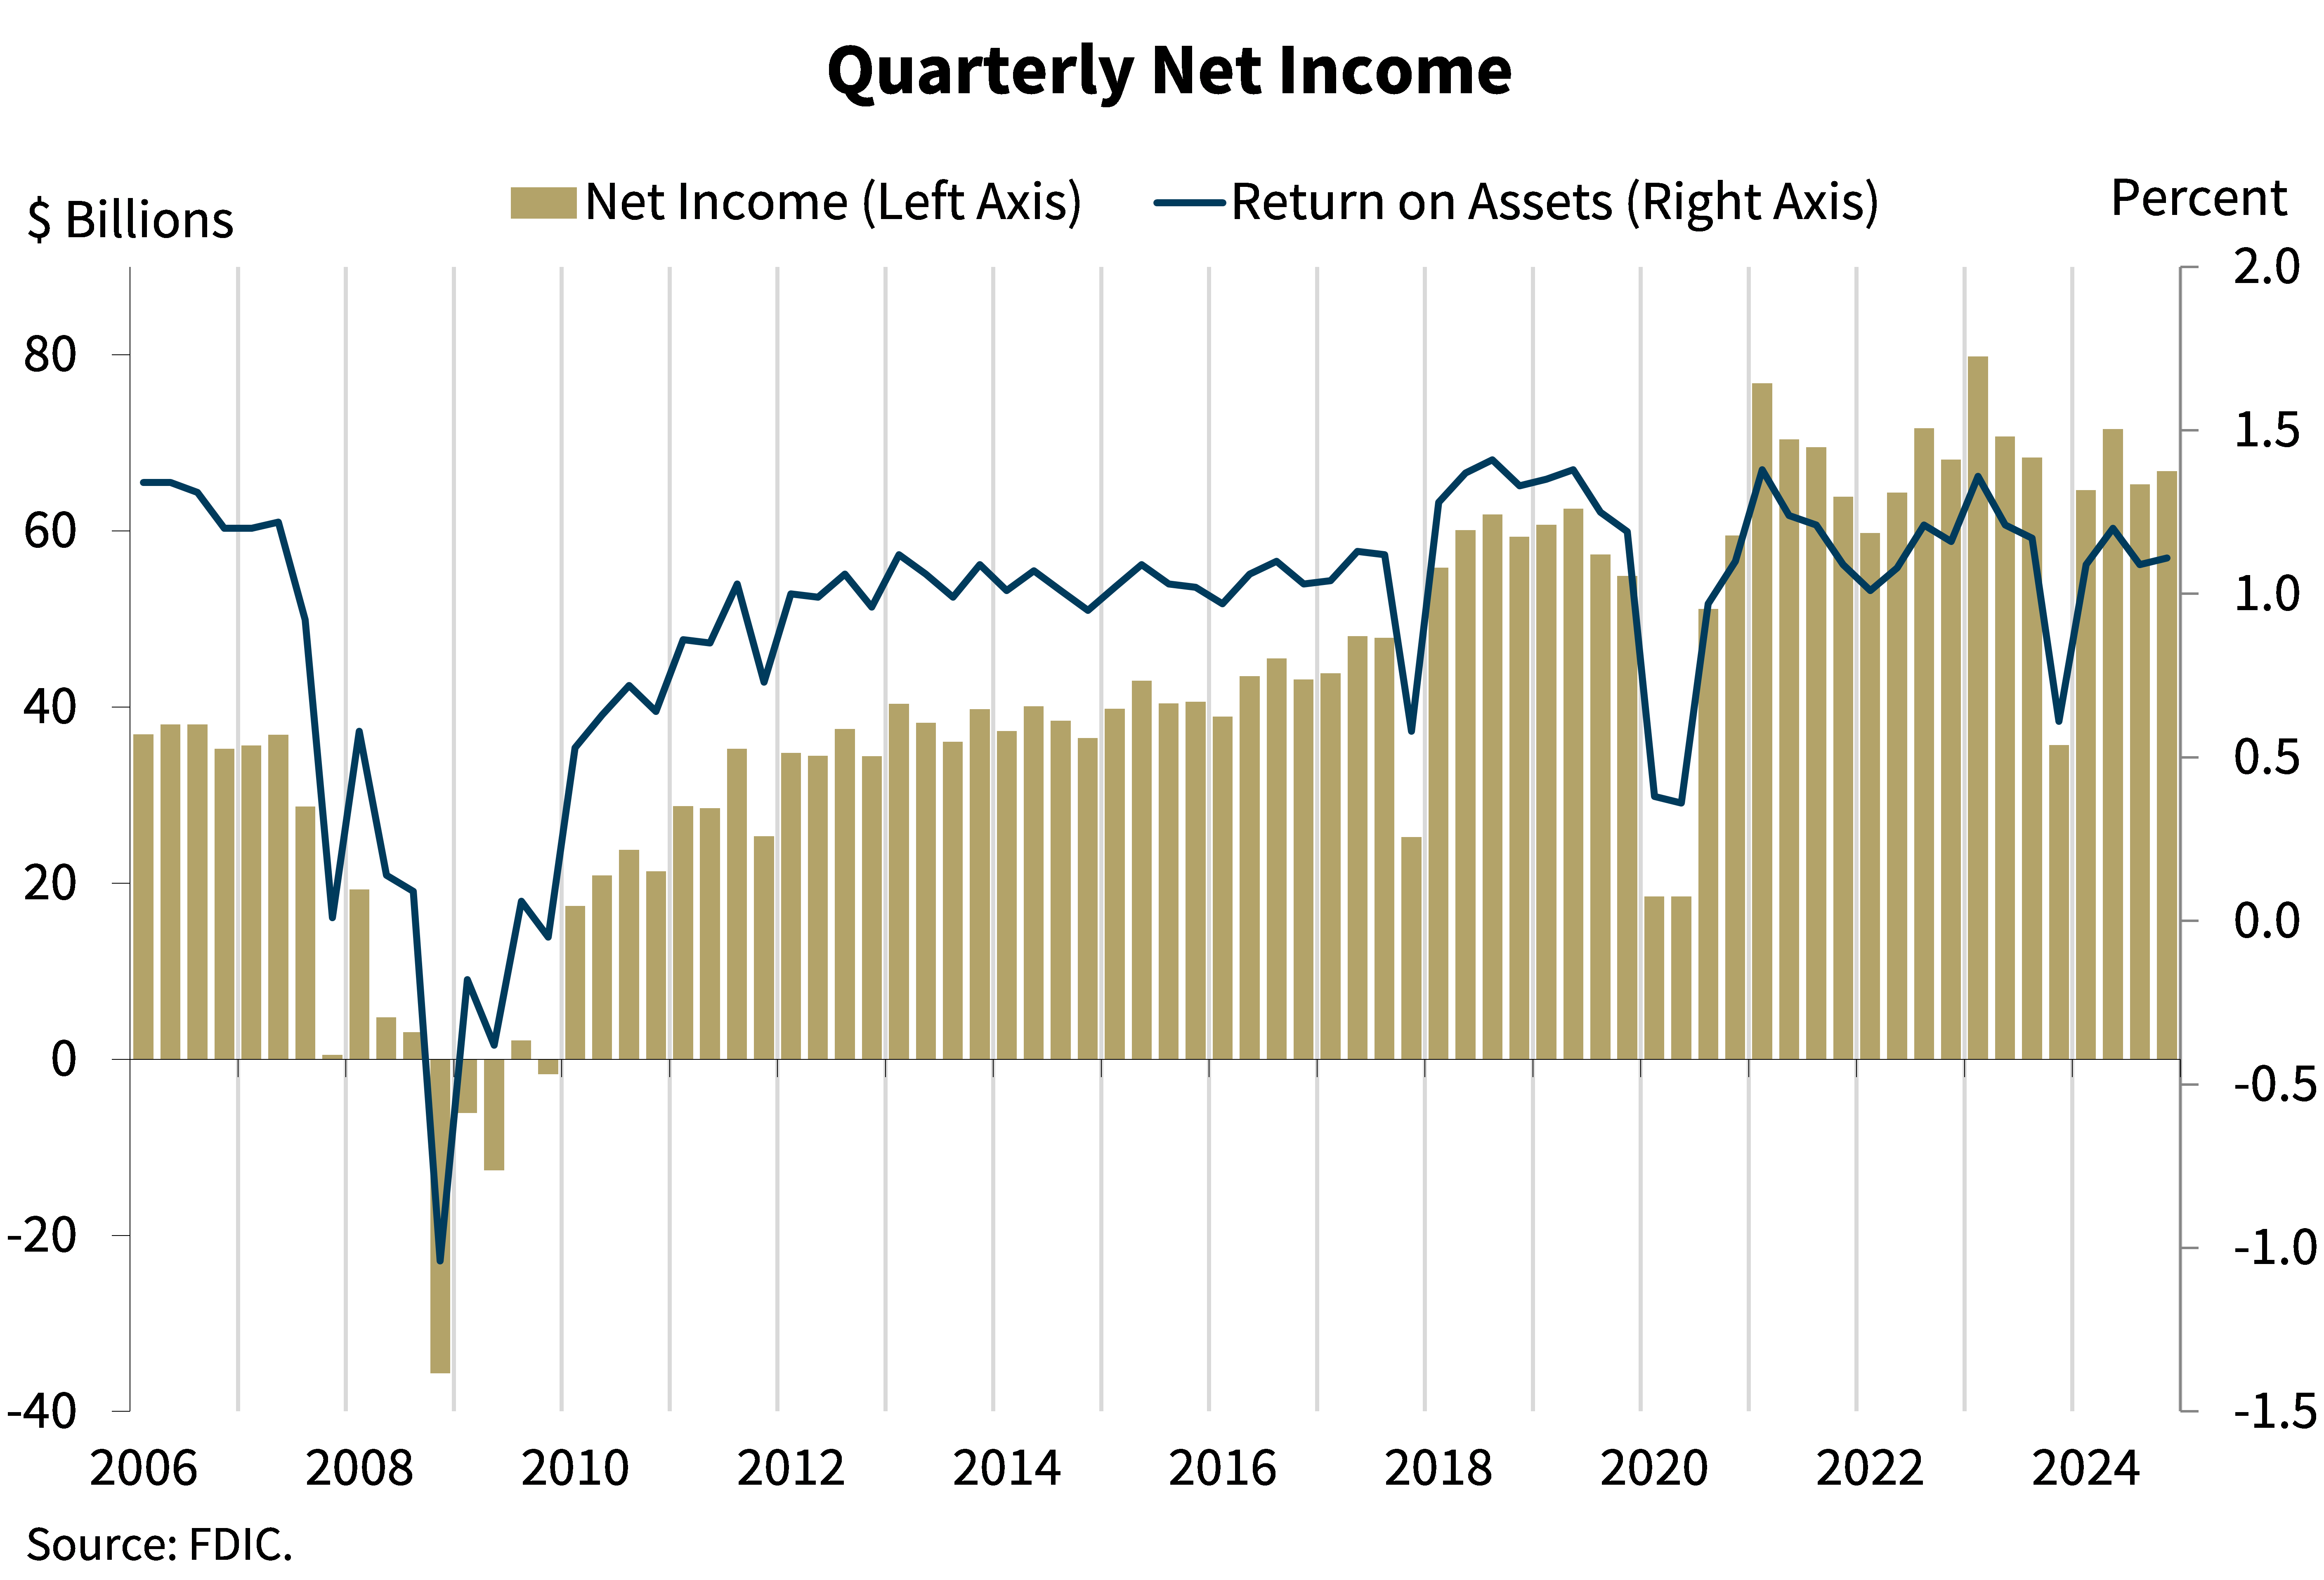
This chart shows that the banking industry reported quarterly net income of $66.8 billion, an increase of $1.5 billion, or 2.3 percent, from the prior quarter. The quarterly increase in income was mainly due to recent short-term interest-rate cuts, which caused interest expenses to decline more than interest income. As a result, the industry reported an increase in net interest income of $3.8 billion this quarter. The banking industry reported an ROA ratio of 1.11 percent in fourth quarter 2024, up 2 basis points from one quarter earlier and up 50 basis points from one year earlier.
Community bank quarterly net income decreased 6.5 percent from the prior quarter to $6.4 billion, driven by higher noninterest expense, higher provision expenses, and realized losses on the sale of securities of $566 million.
Chart 3:
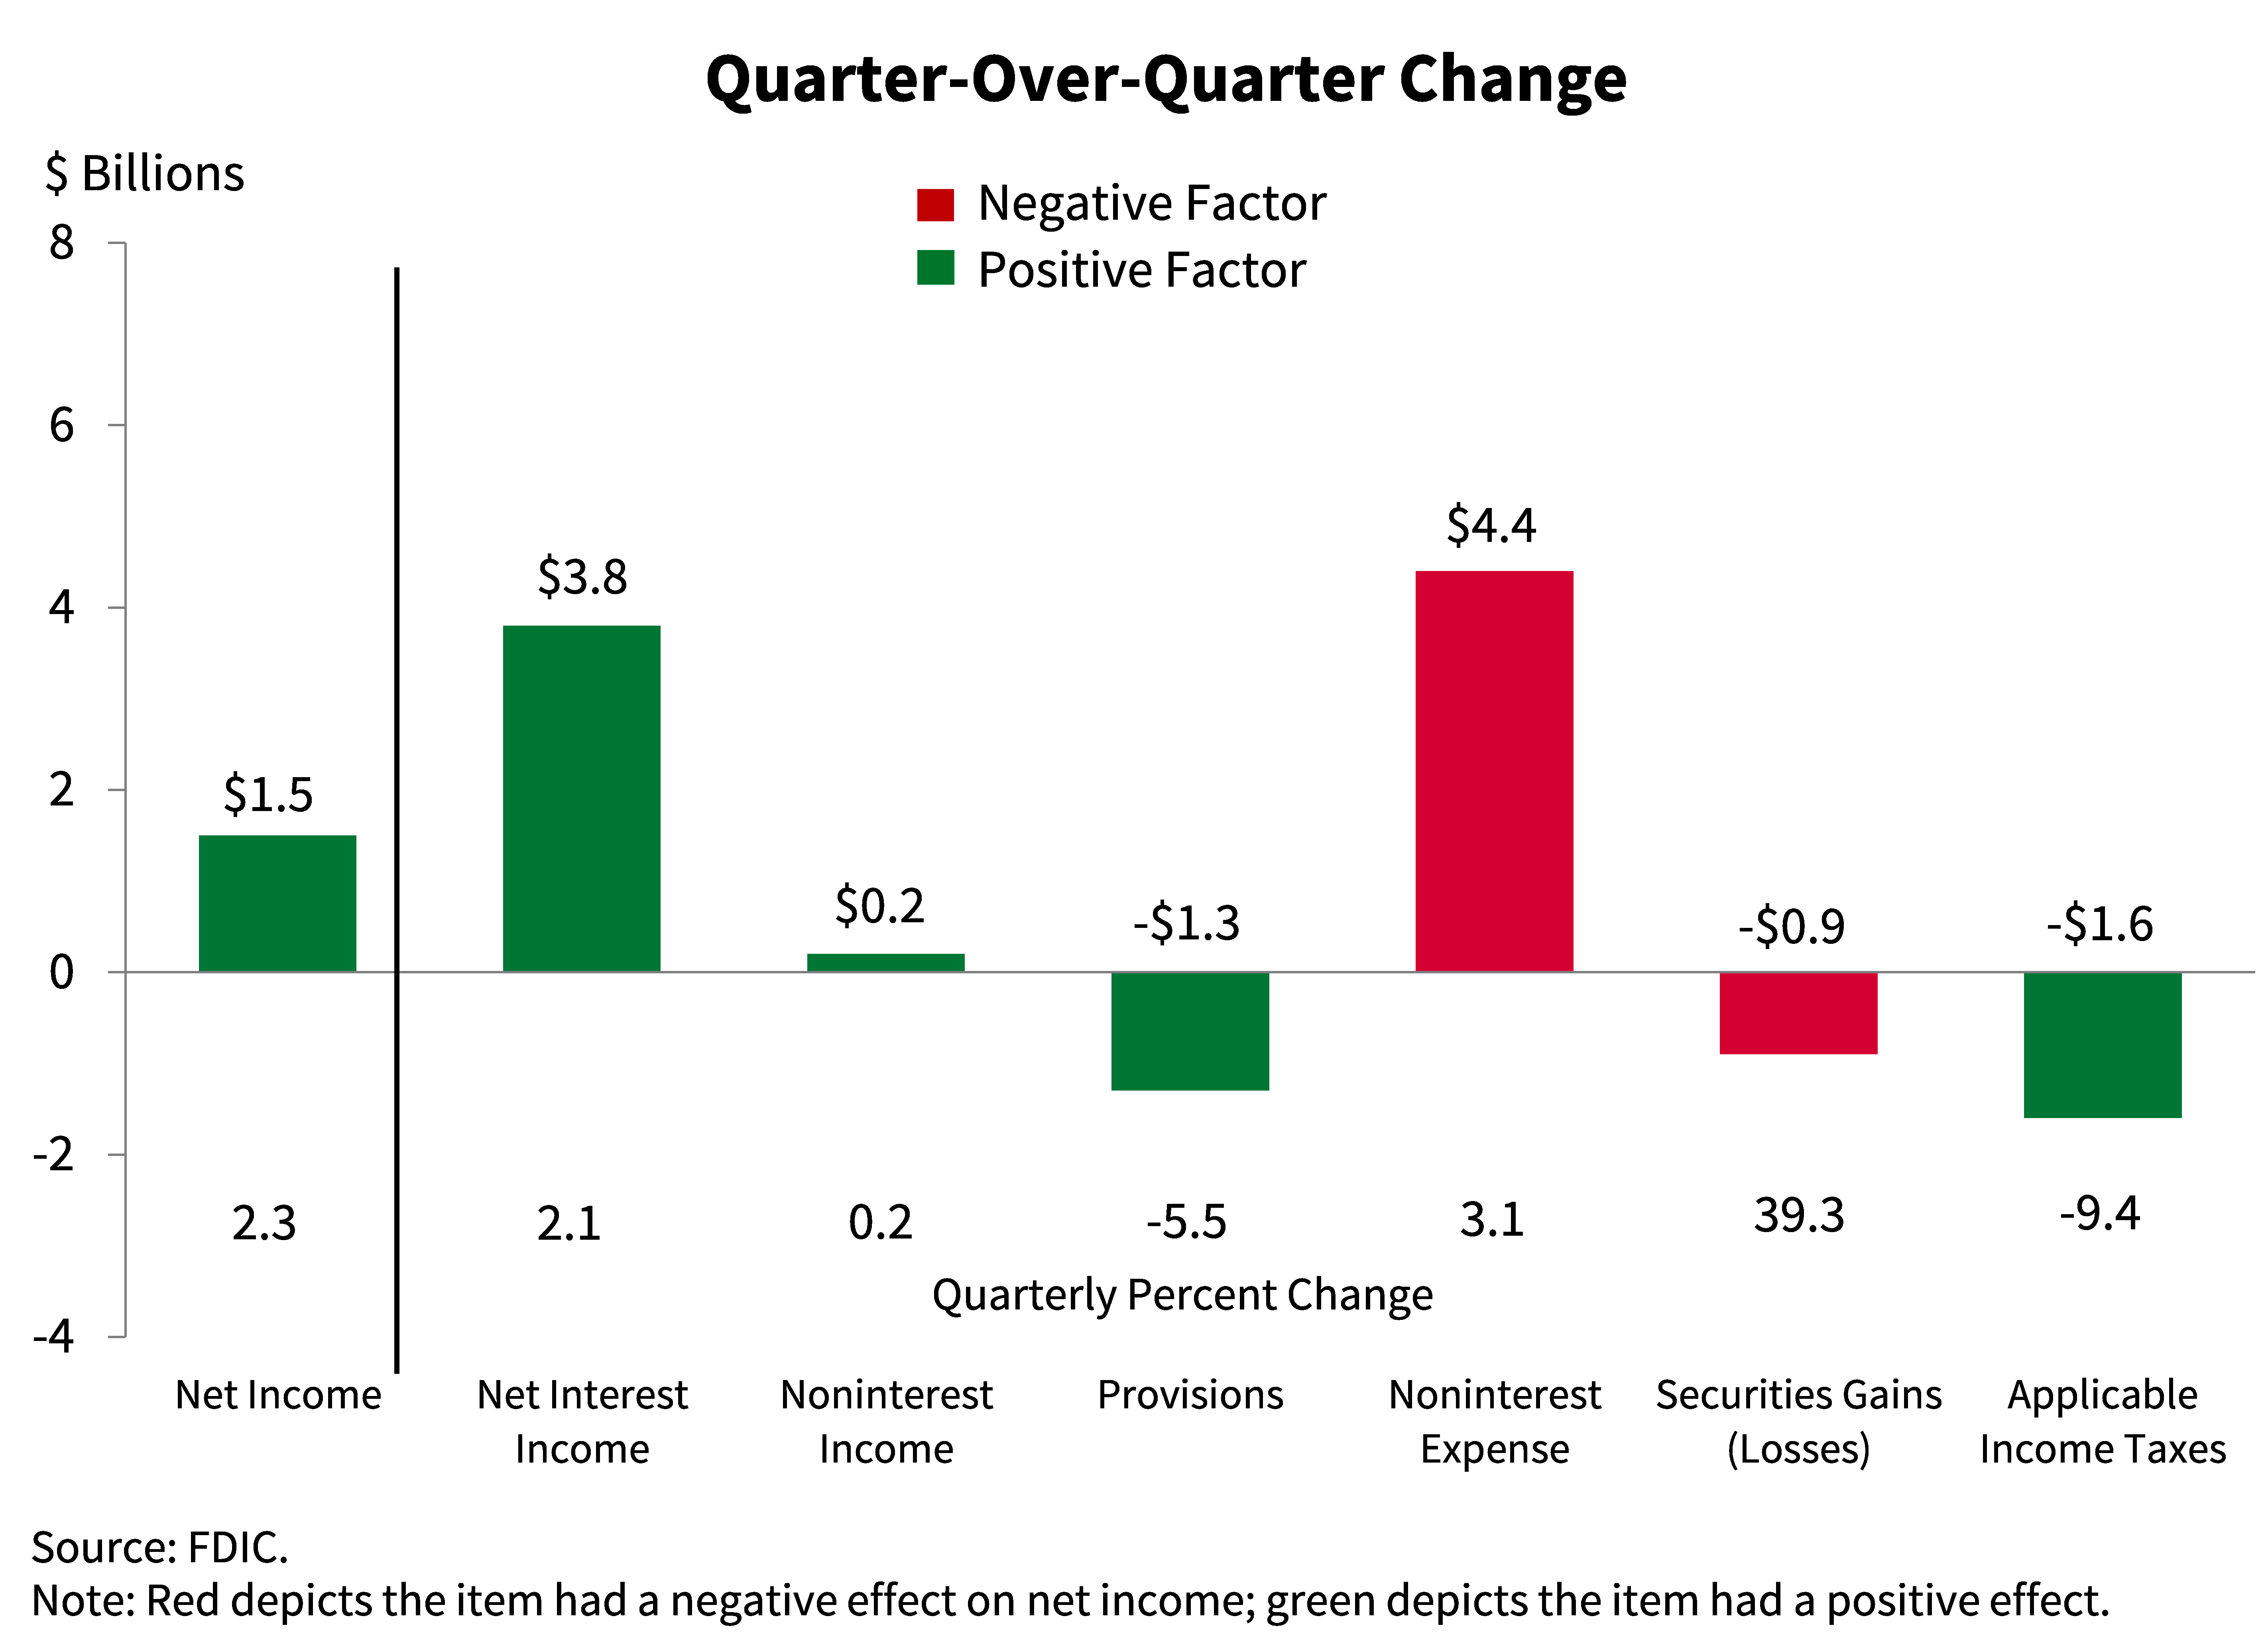
This chart shows the breakdown of the changes in the industry’s net income quarter over quarter. The primary driver of the industry’s $1.5 billion increase in net income was net interest income, which increased $3.8 billion, or 2.1 percent, as interest expense fell faster than interest income in the falling rate environment, leading to higher net interest income. The increase in net income was partially offset by a $4.4 billion, or 3 percent, increase in noninterest expense.
Chart 4:
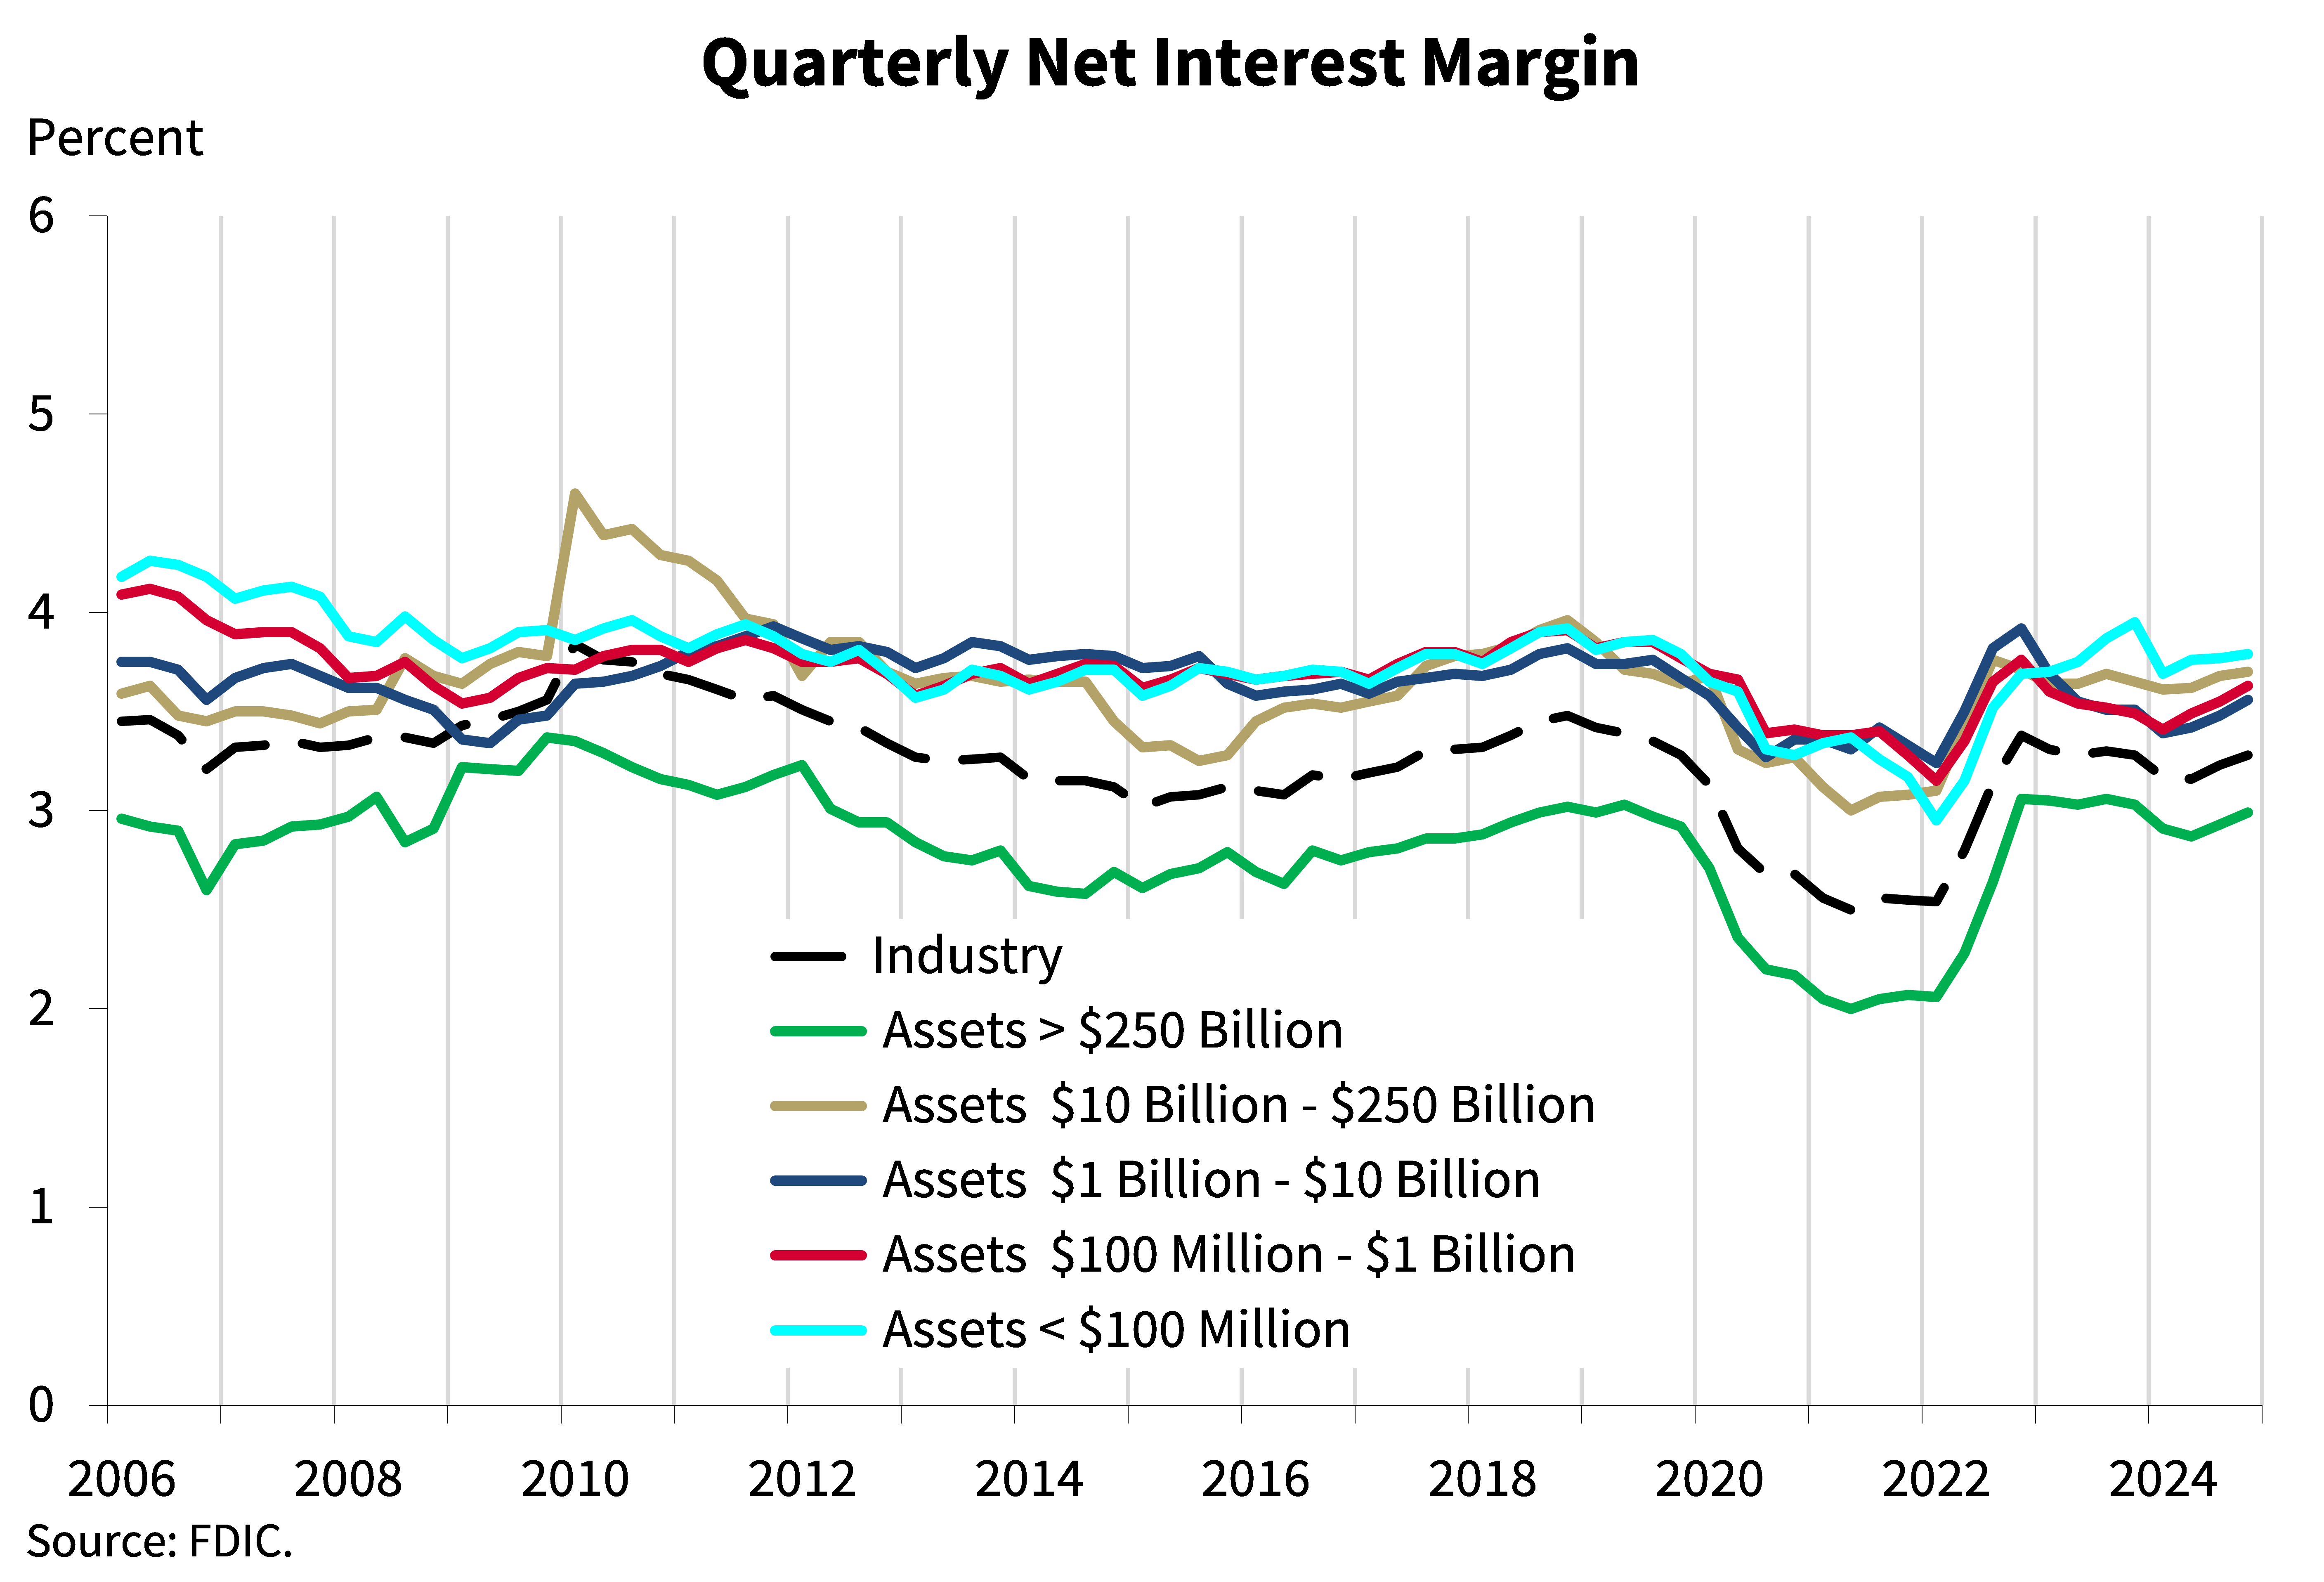
This chart shows the average net interest margin for the industry and for five asset size cohorts. The industry’s NIM increased for a second consecutive quarter, improving 5 basis points from last quarter to 3.28 percent. The industry’s NIM is now above its pre-pandemic average of 3.25 percent.1 The NIM increased for all size cohorts in the fourth quarter, driven by lower funding costs. The industry’s full-year net interest margin (NIM) was 3.22 percent, 8 basis points lower than 2023, but higher than the industry’s reported NIM from 2020 through 2022.
The community bank NIM increased for the third straight quarter to 3.44 percent, up 9 basis points from prior quarter. Despite the improvement, community bank NIM remained below the pre-pandemic average of 3.63 percent.
Chart 5:
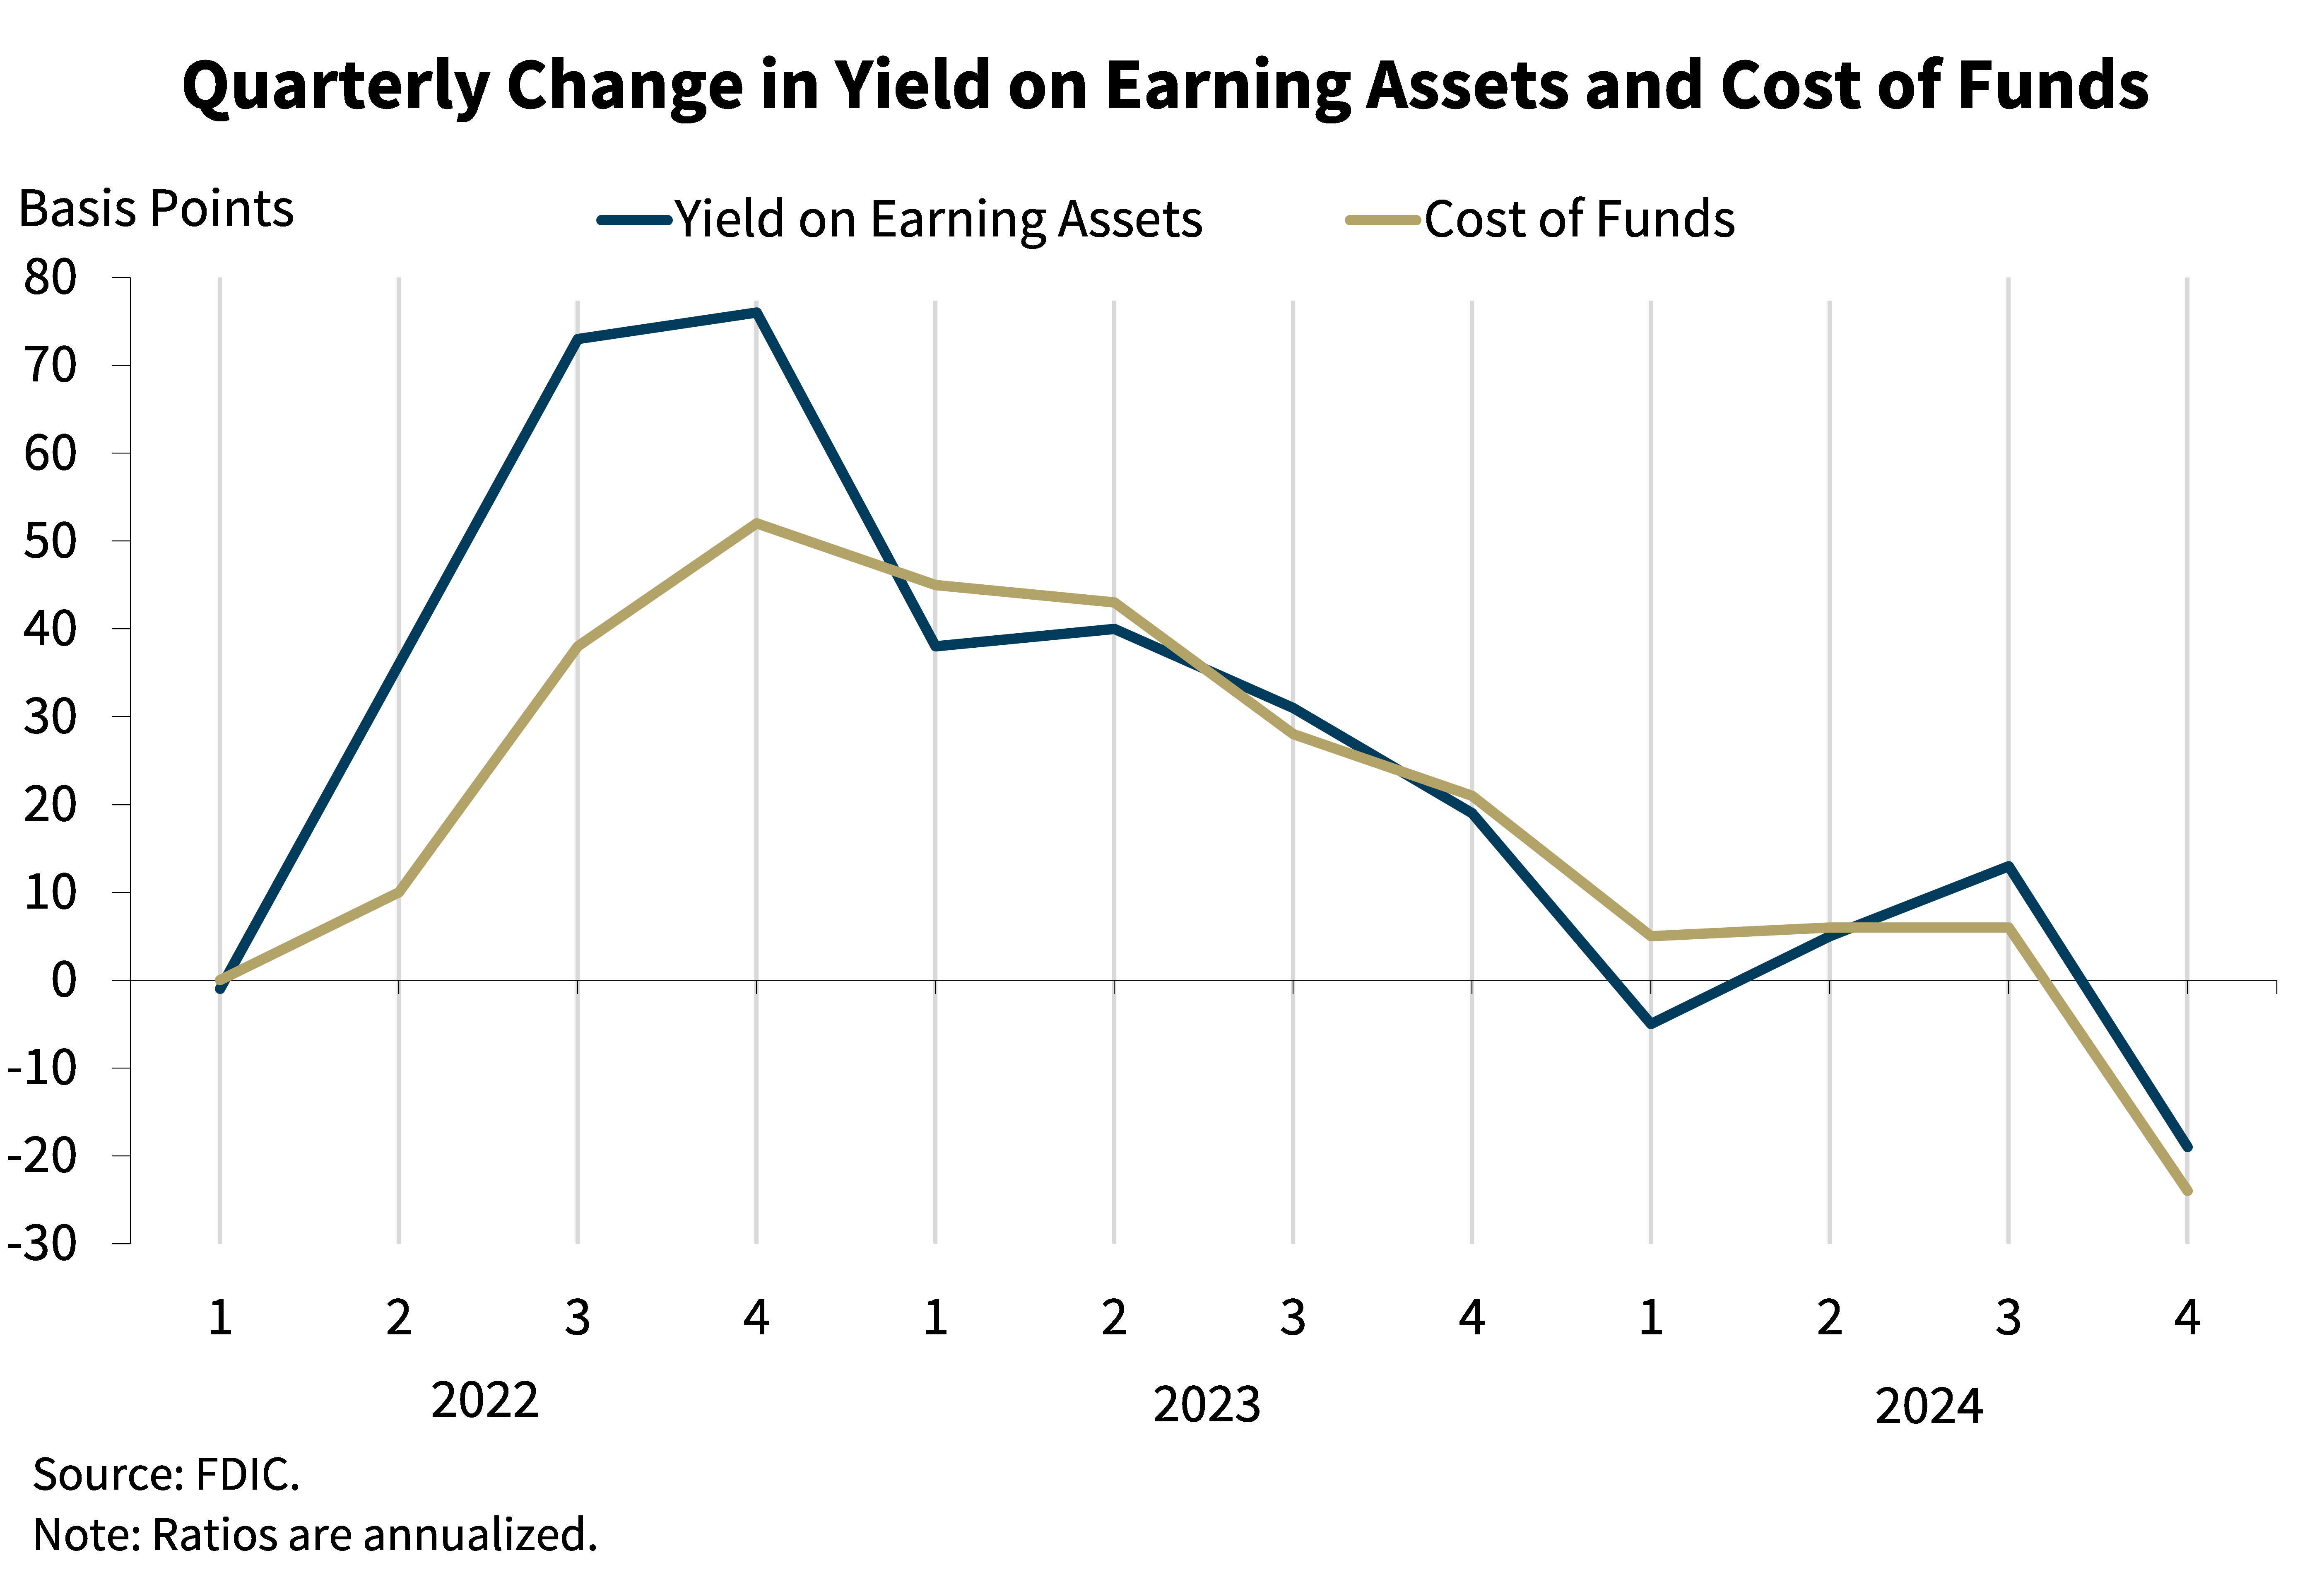
The next chart shows the quarter-over-quarter changes in the industry’s average yield on earning assets and average cost of funds. During the quarter, the yield on earning assets decreased 19 basis points and cost of funds decreased 24 basis points, which drove the increase in the industry’s NIM this quarter. This decline in yields and interest costs reflects the three rate cuts by the Federal Reserve in the second half of 2024. The industry’s decrease in costs of funds in the fourth quarter was the largest decline since second quarter 2020.
Community banks’ NIM increase in the fourth quarter was driven by an 11 basis-point decrease in the cost of funds, outpacing a 3 basis-point decrease in earning asset yields.
Chart 6:
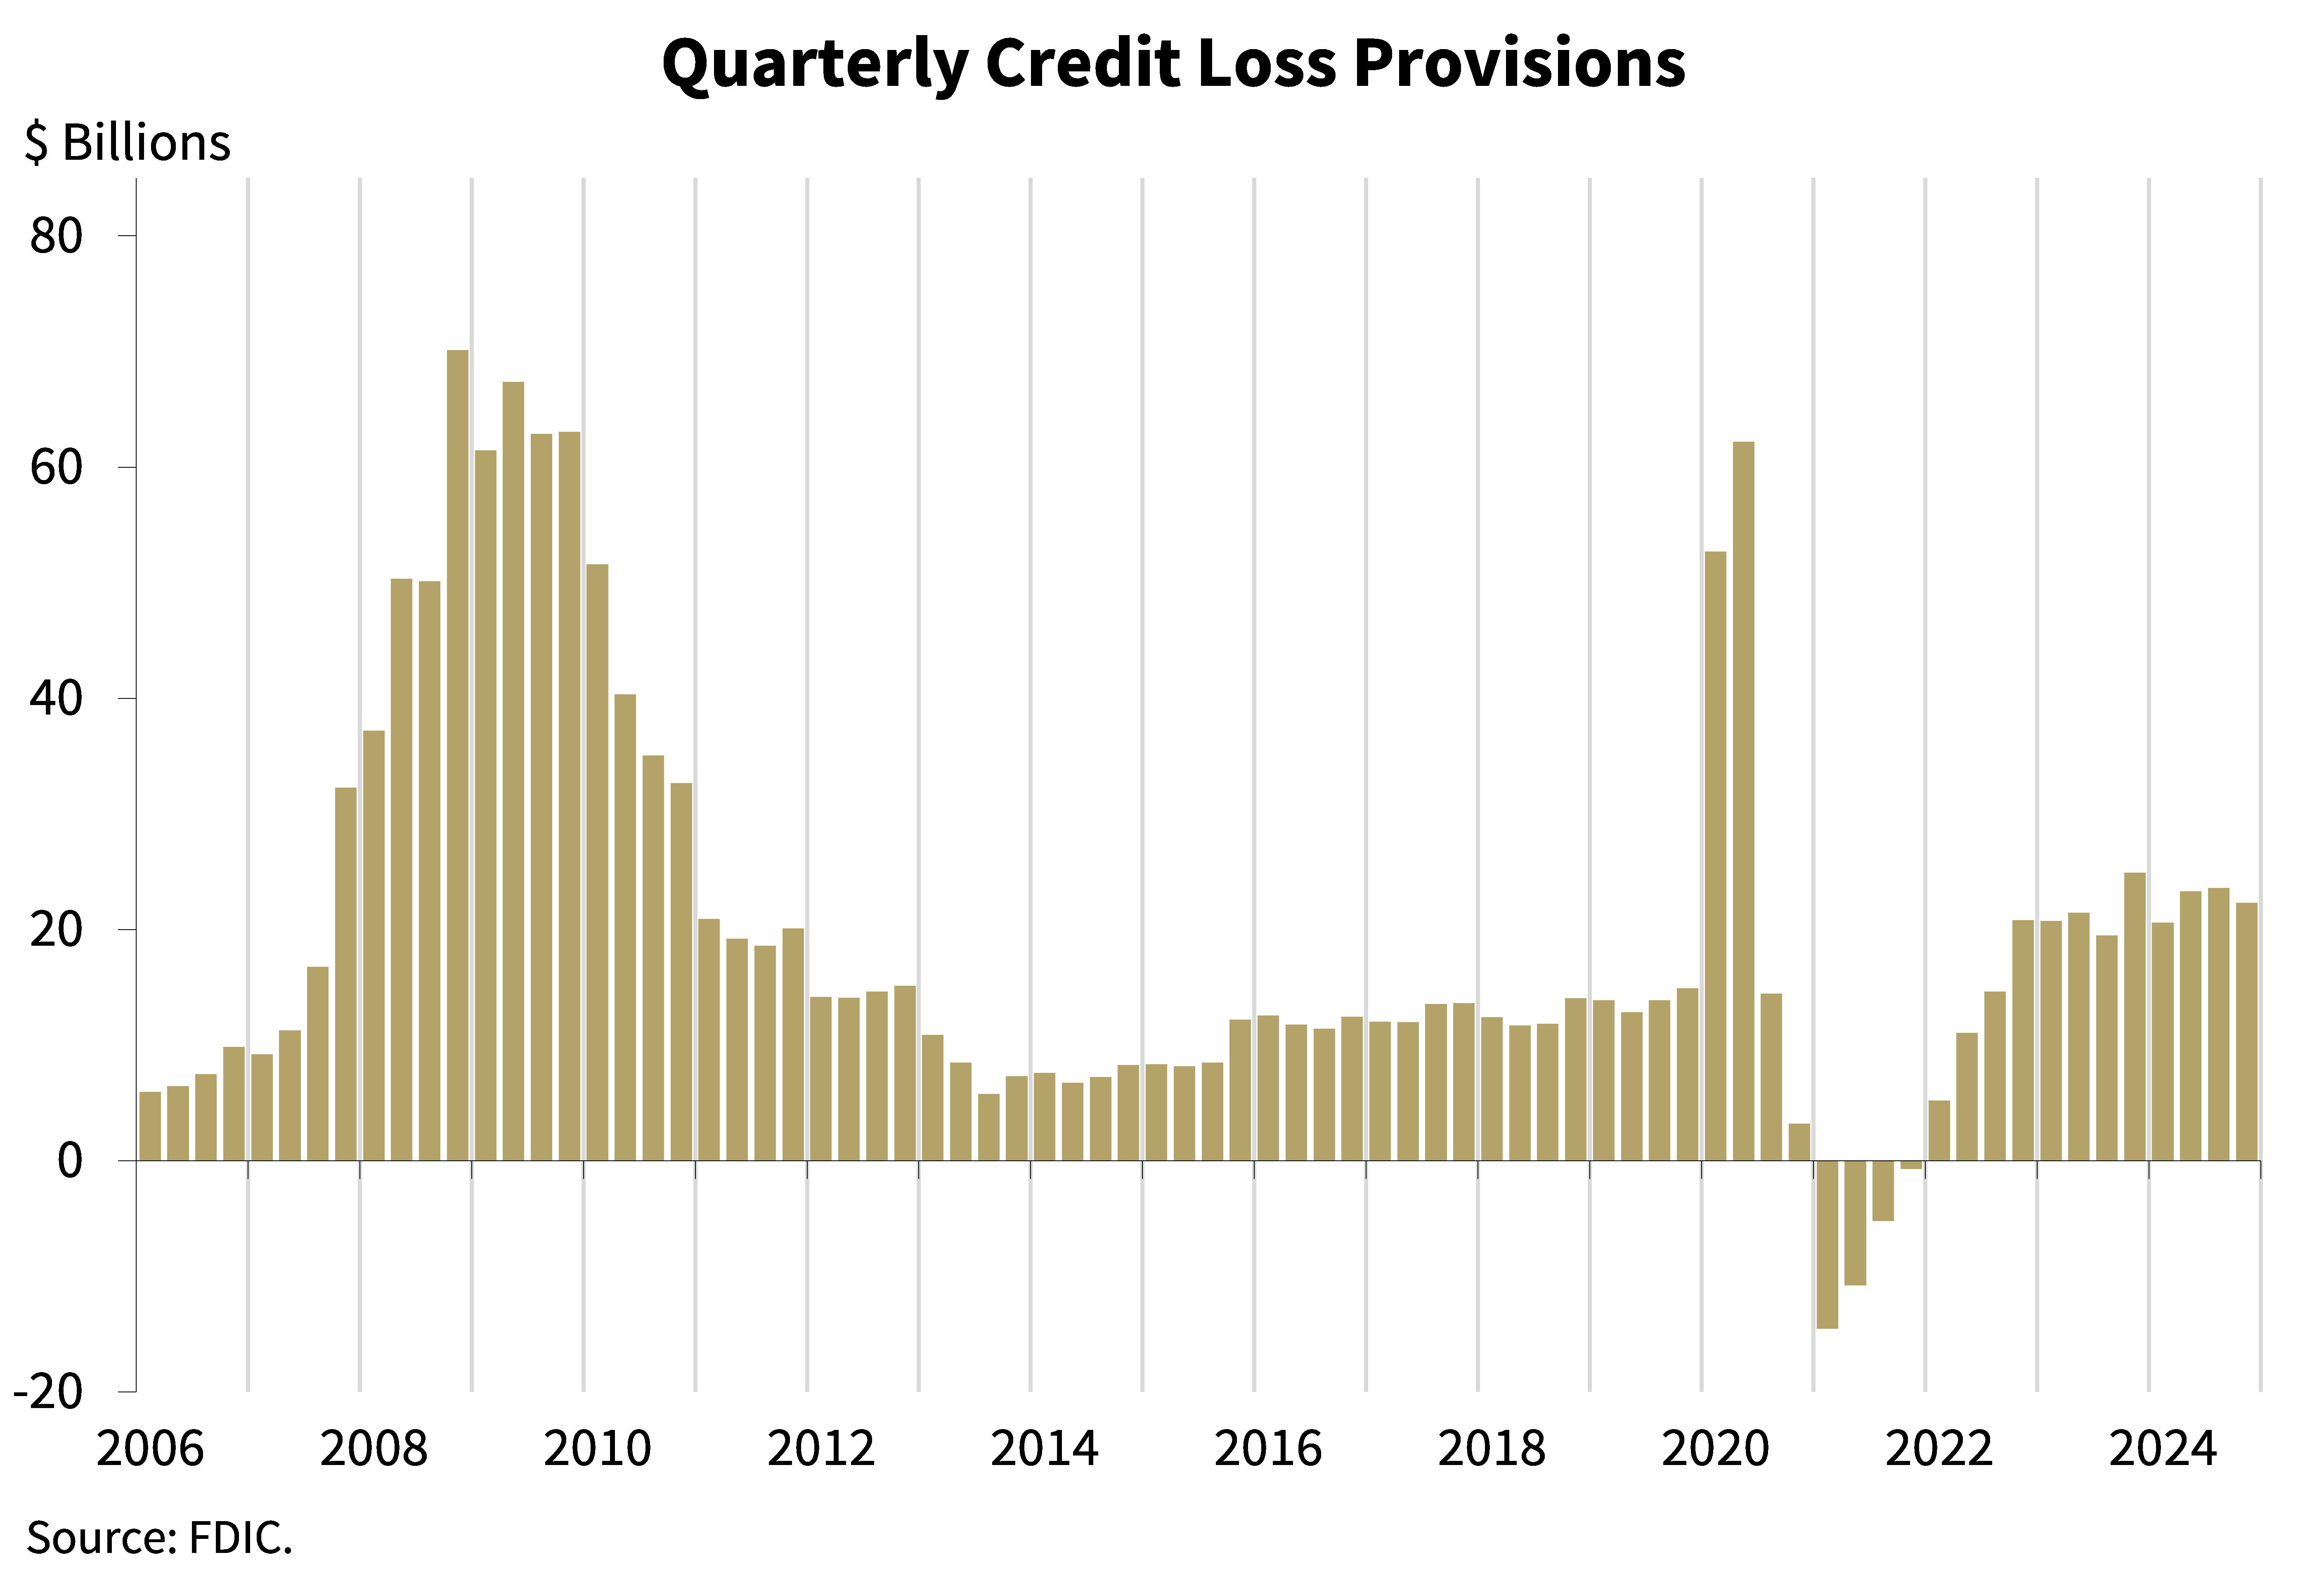
The next chart shows that the industry’s provision expense was $22.3 billion in the fourth quarter, down $1.3 billion from the third quarter. The provision expense matched net charge-offs for the quarter, keeping the allowance stable from the prior quarter at $222.8 billion. The industry’s provision expense has been higher than the pre-pandemic average for the past ten quarters.
Chart 7:
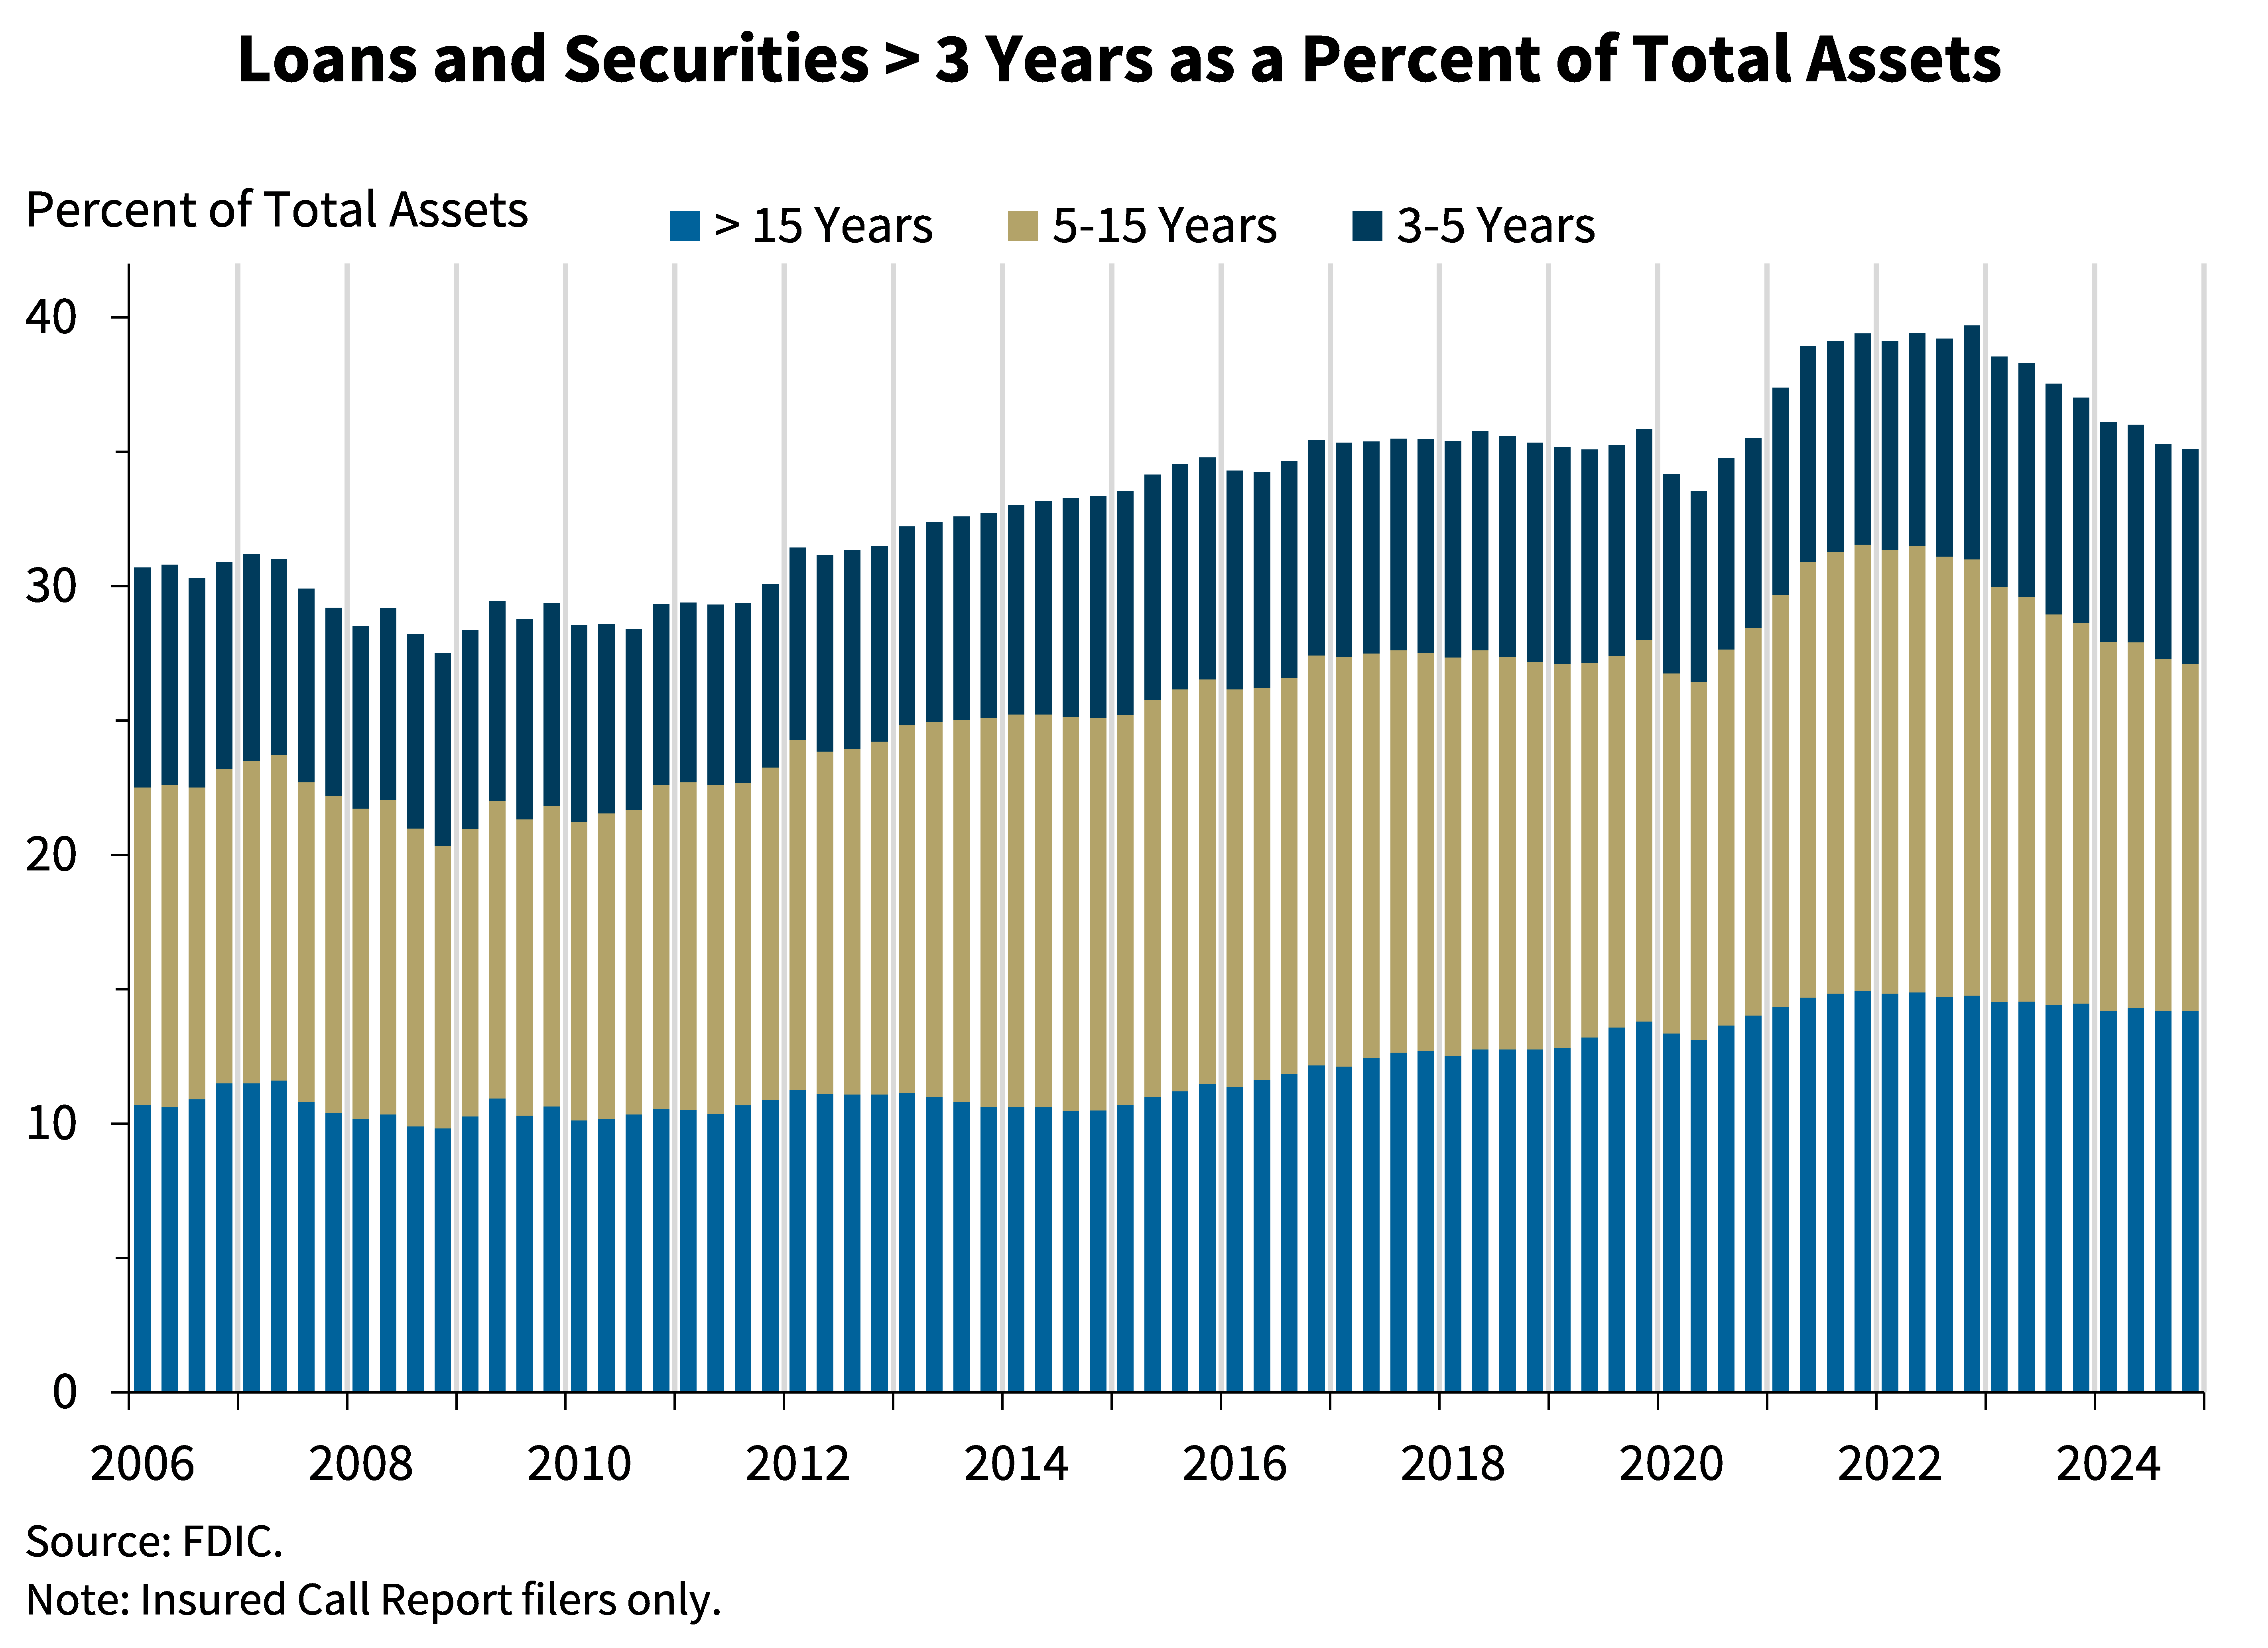
This chart shows that the banking industry’s share of total assets made up of longer-term loans and securities fell for the eighth consecutive quarter to 35.2 percent after peaking at 39.7 percent in fourth quarter 2022. The industry’s longer-term assets as a share of total assets is still slightly above the pre-pandemic average of 35.0 percent.
At community banks, longer-term loans and securities made up 45.0 percent of total assets in fourth quarter 2024, down from 46.3 percent last quarter and below the pre-pandemic average of 48.9 percent.
Chart 8:
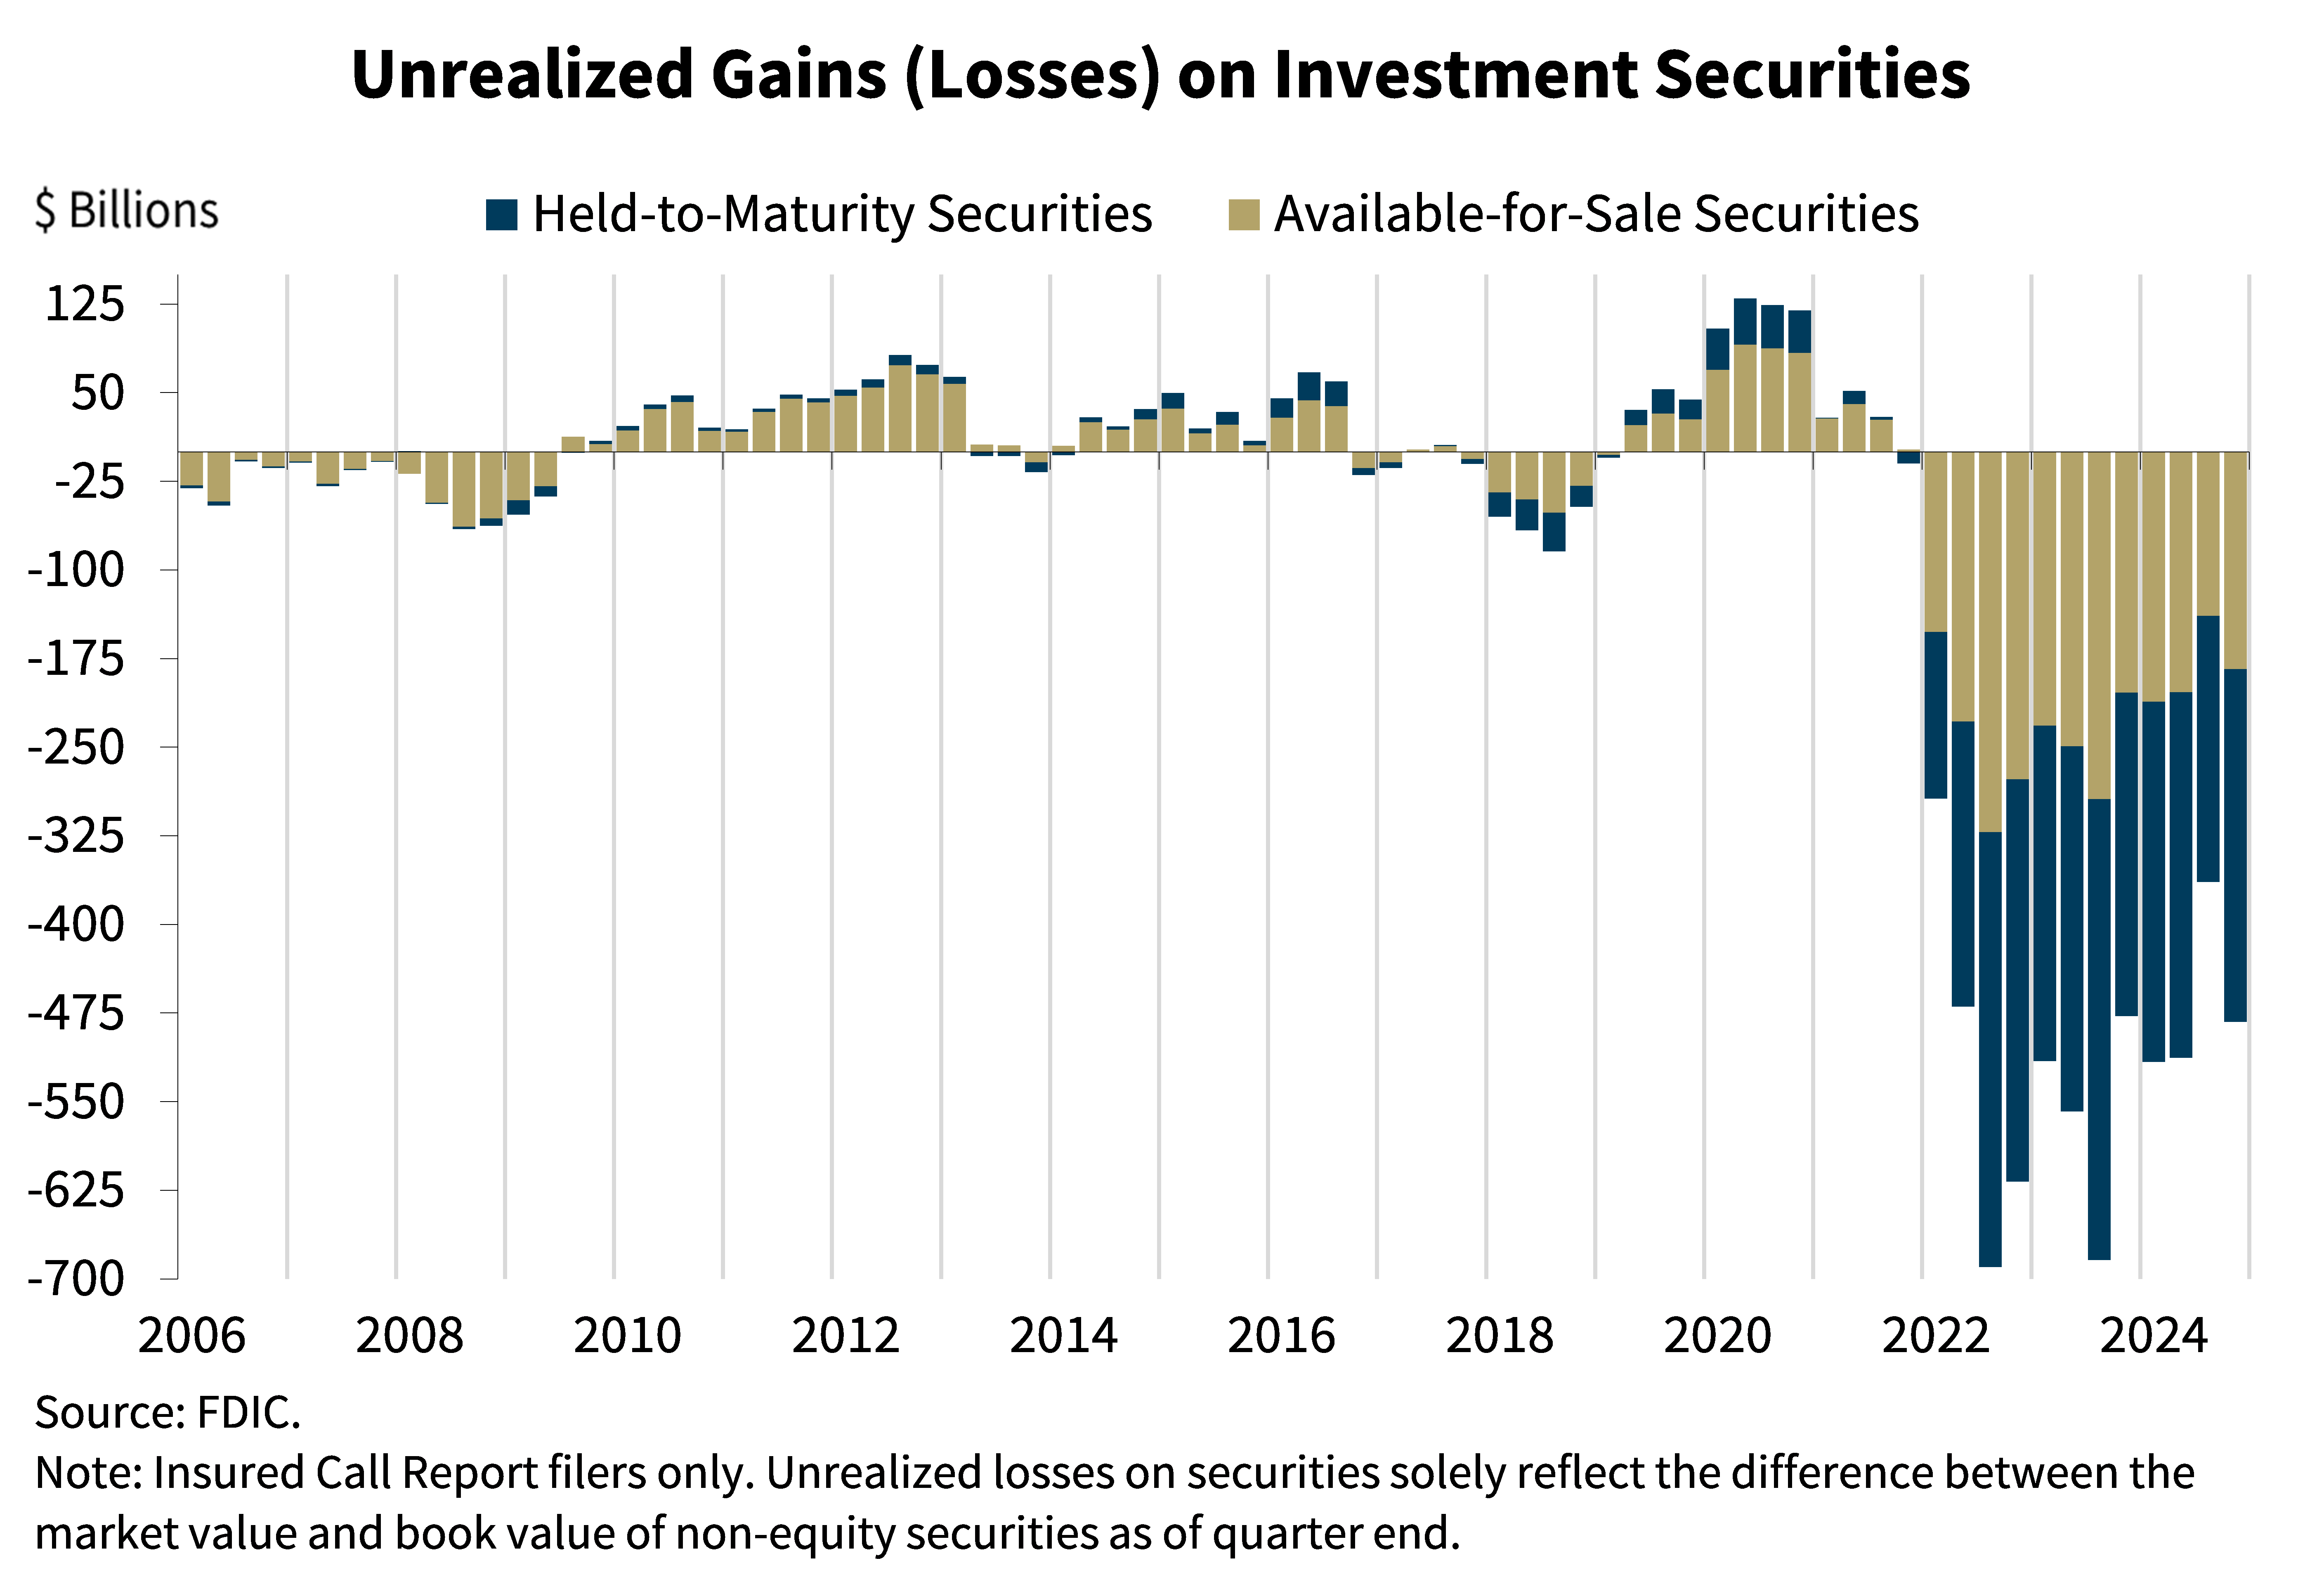
The next chart shows the level of unrealized losses on held-to-maturity and available-for-sale securities portfolios.2 Total unrealized losses of $482.4 billion increased $118.4 billion (32.5 percent) from the prior quarter. Longer-term interest rates such as the 30-year mortgage rate and the 10-year Treasury rate increased in the fourth quarter after declining in the third quarter, decreasing the value of securities reported by banks and increasing unrealized losses.
Chart 9:
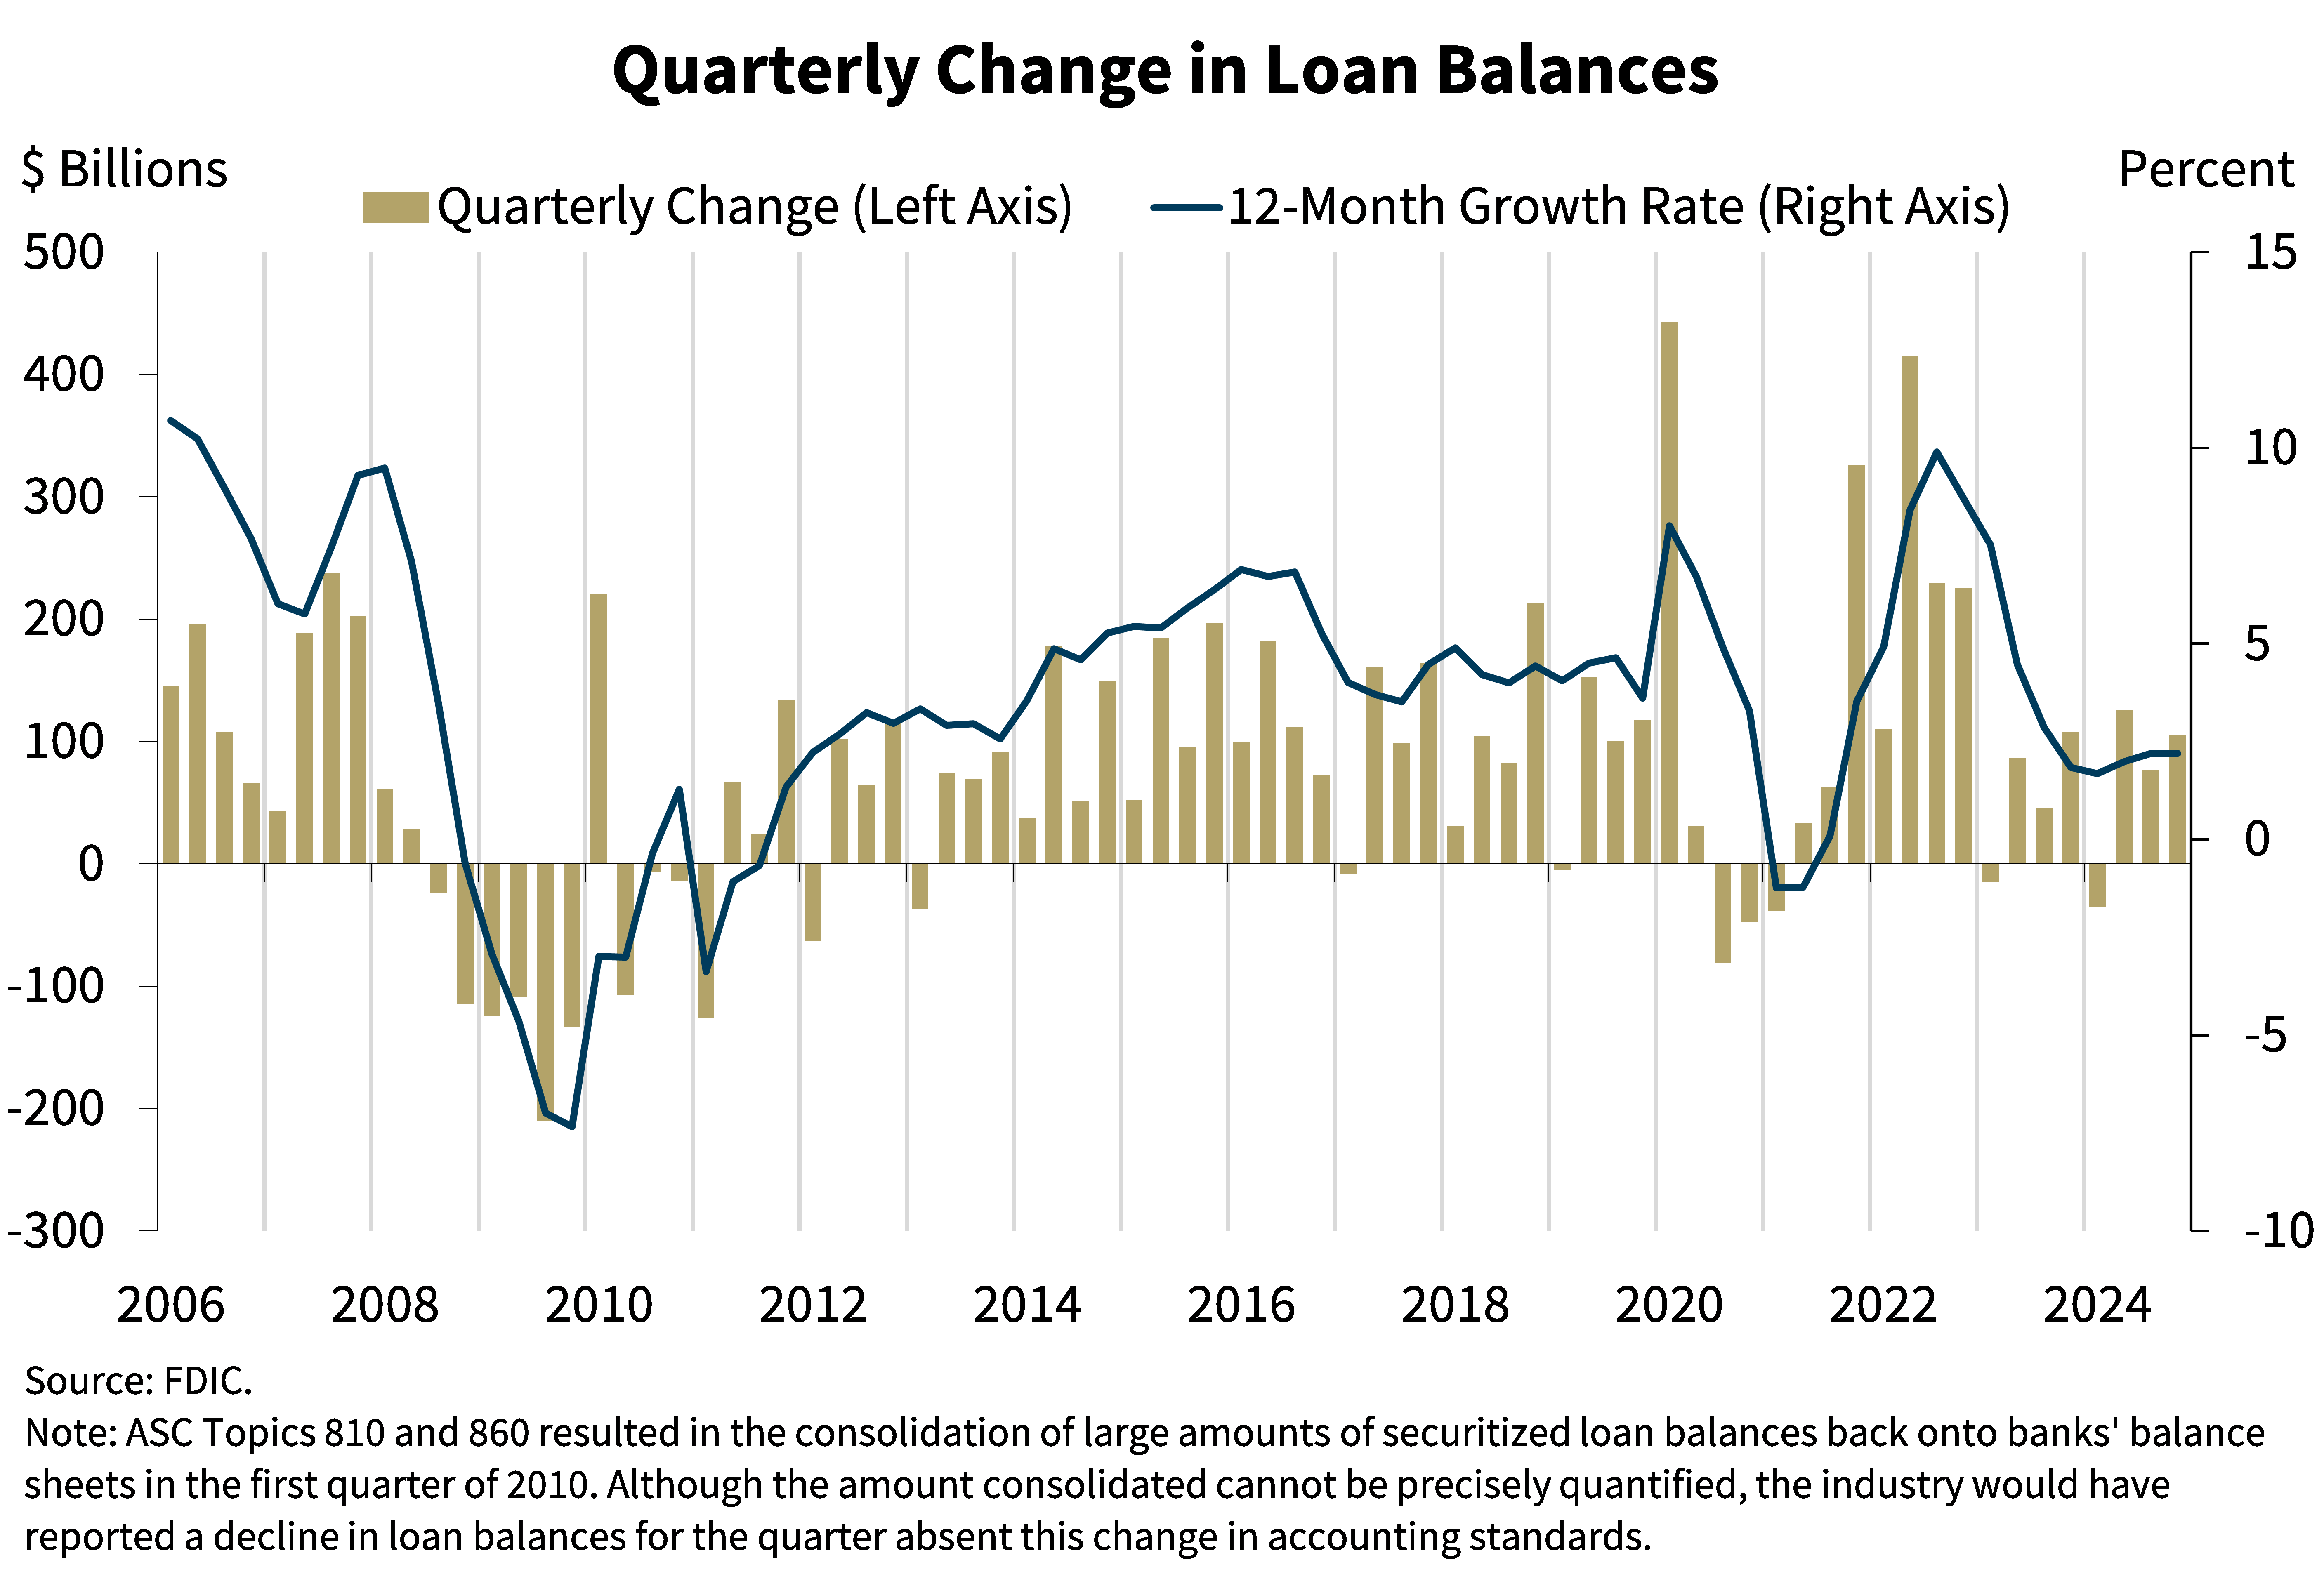
The next chart shows the change in loan balances on a quarterly and annual basis. The industry’s total loans increased by $105.2 billion, or 0.8 percent, in the fourth quarter. The largest portfolio increases were reported in “all other” loans and loans to non-depository financial institutions, largely due to reclassifications following the finalization of changes to how certain loan products should be reported. Reclassifications also likely caused declines in other loan categories from which the loans were reclassified, particularly C&I and “other” consumer loans. In addition to these reclassifications, credit card loans and organic growth in loans to non-depository financial institutions contributed to quarterly loan growth. The industry’s annual rate of loan growth remained steady in the fourth quarter at 2.2 percent.
Community bank loan growth was more robust and widespread than the industry’s growth. Total loans at community banks increased 1.3 percent from the prior quarter and 5.1 percent from the prior year, led by increases in nonfarm nonresidential CRE and residential mortgage portfolios.
Chart 10:
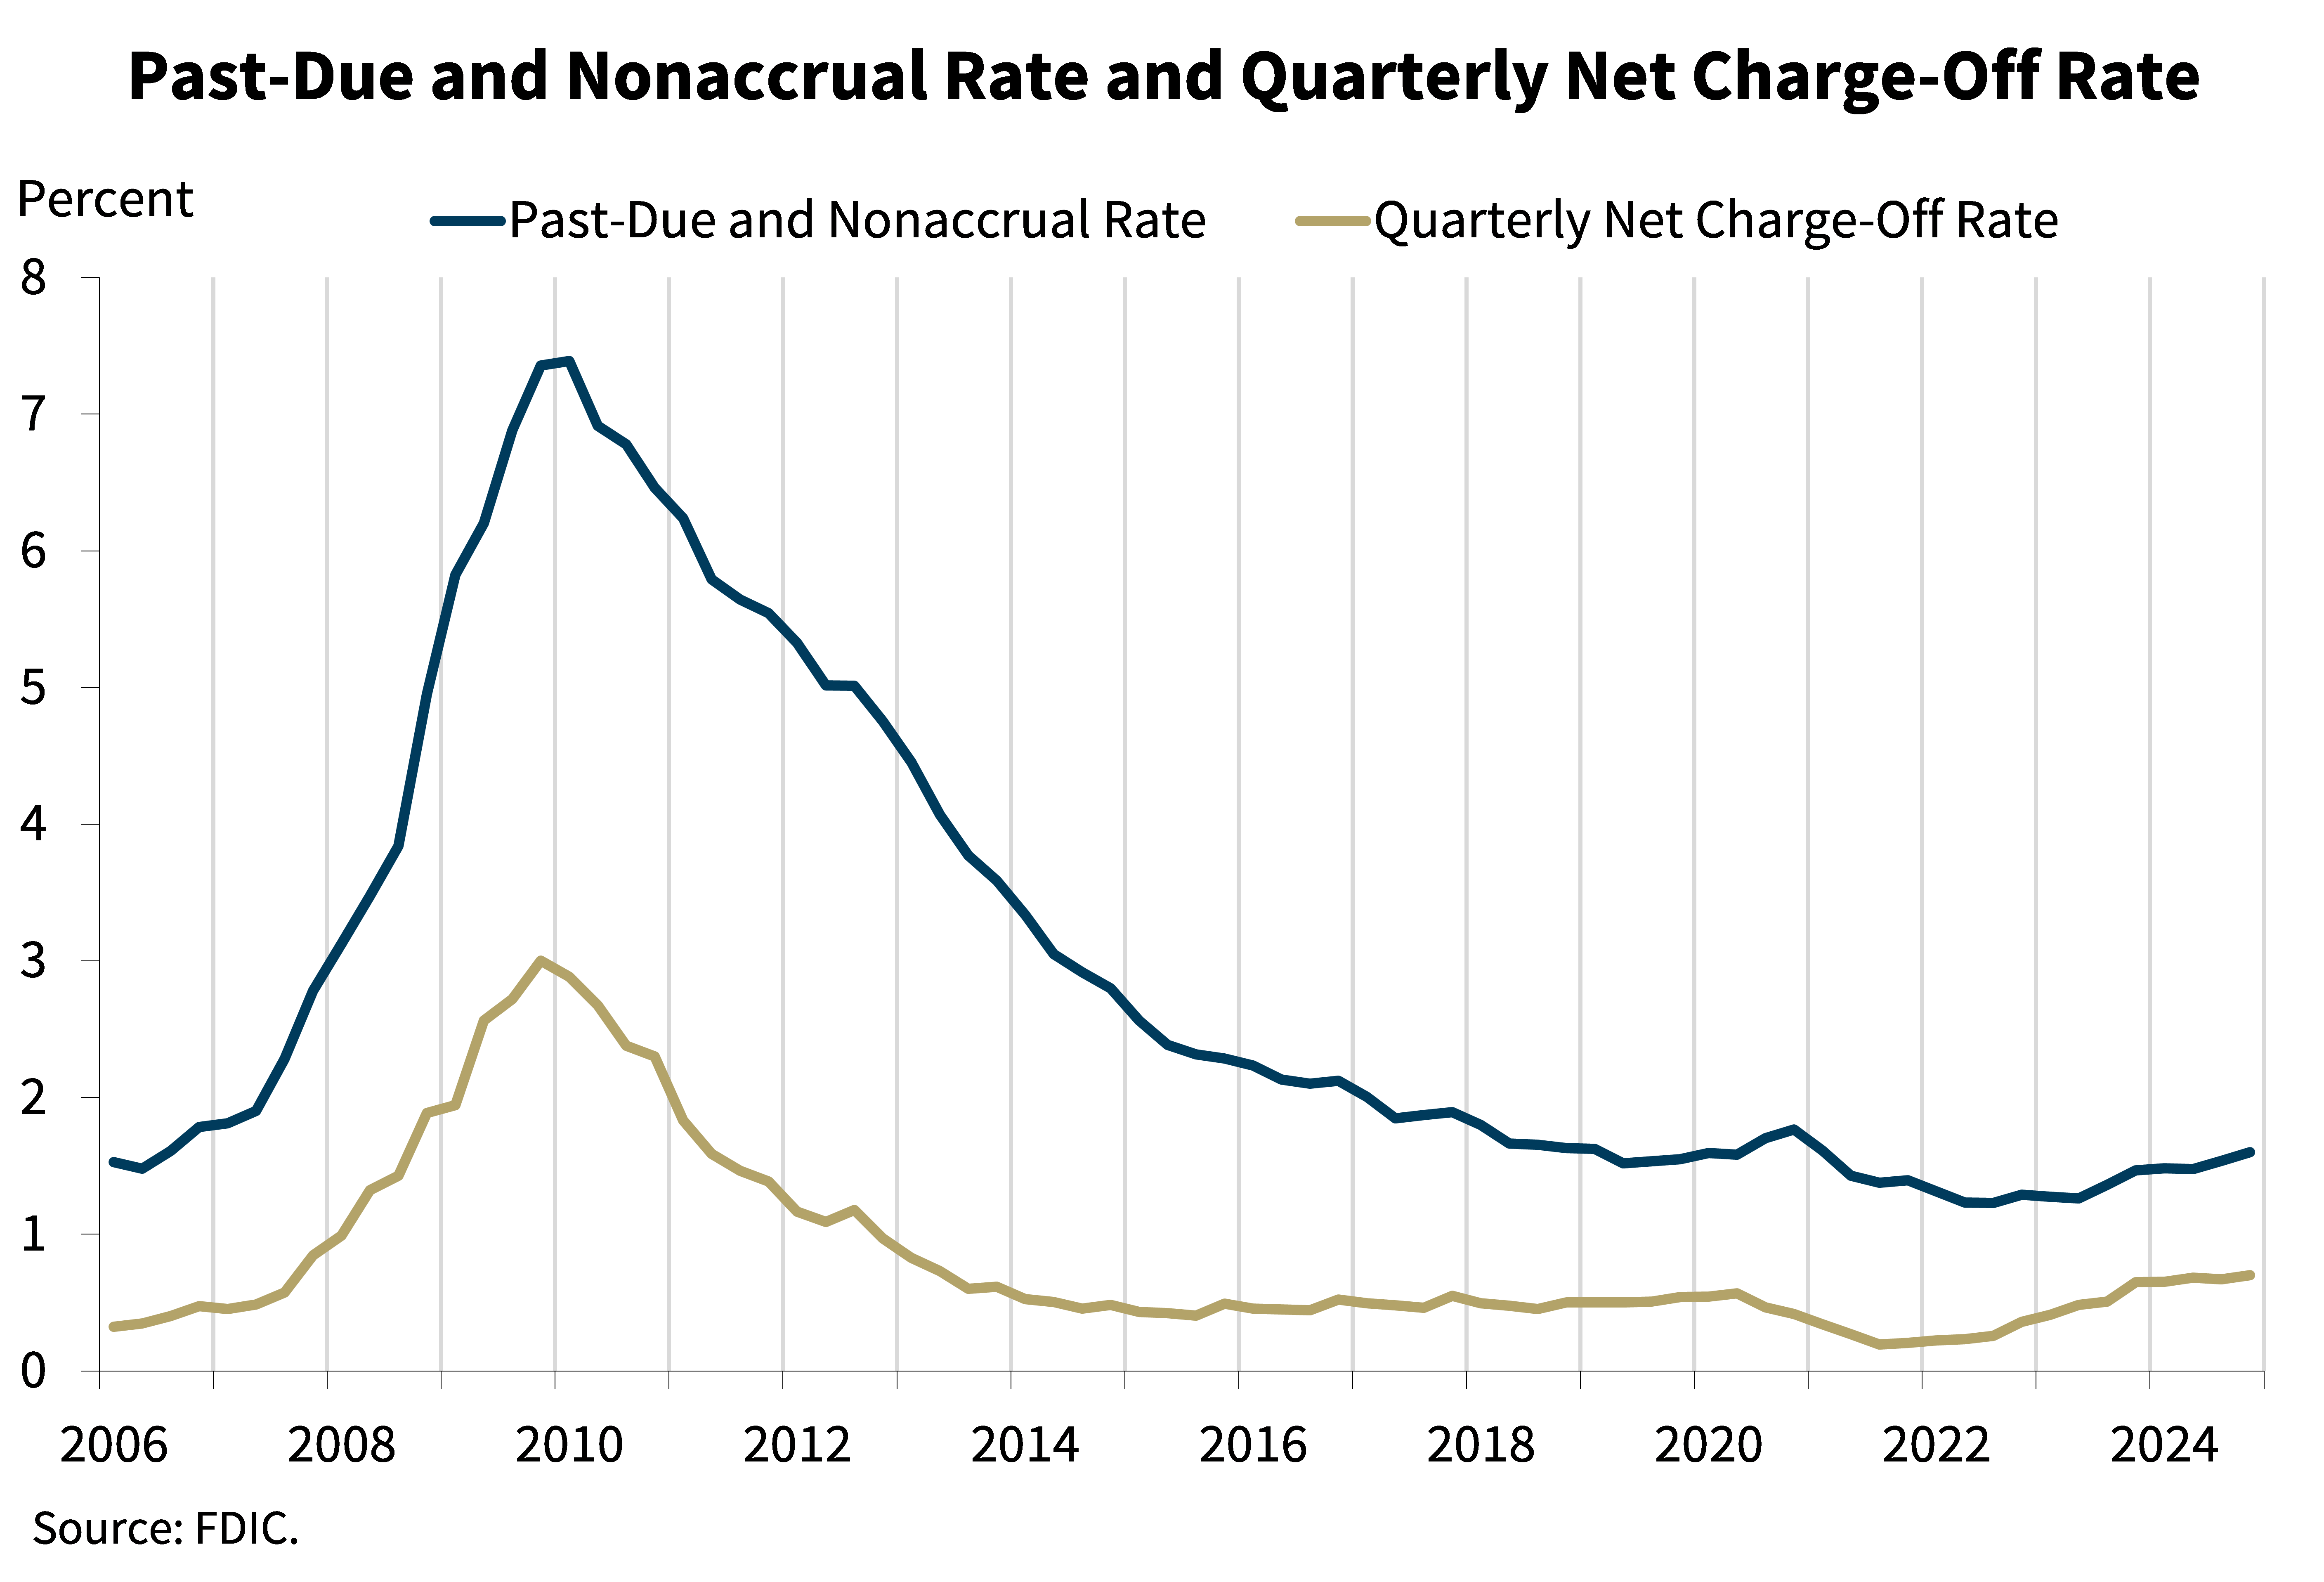
The next chart shows that asset quality metrics for the industry remained generally favorable despite modest deterioration in some portfolios. The overall past-due and nonaccrual (PDNA) rate increased 6 basis points from the prior quarter to 1.60 percent, a level still well below the pre-pandemic rate of 1.94 percent.3 The industry’s 1-4 family, multifamily, C&I, auto and credit card portfolios contributed the most to the increase in industry’s PDNA rate during the fourth quarter. The PDNA rate for 1-4 family loans increased 14 basis points to 1.97 percent from the previous quarter, the multifamily PDNA rate increased 38 basis points to 1.35 percent, the C&I PDNA rate increased 14 basis points to 1.31 percent, and the auto loan rate increased 20 basis points to 3.33 percent. The industry’s credit card, auto, nonfarm nonresidential CRE, and multifamily PDNA rates remain above their pre-pandemic averages.
The industry’s quarterly net charge-off rate of 0.70 percent increased 3 basis points from last quarter and was 19 basis points higher than the year-ago quarter. The industry’s net charge-off rate was also 22 basis points higher than the pre-pandemic average. Credit card and nonfarm nonresidential portfolios drove the quarterly increase in the total net charge-off rate. The credit card net charge-off rate was 4.57 percent in the fourth quarter, up 9 basis points quarter over quarter and 109 basis points higher than the pre-pandemic average. The net charge-off rate for nonfarm nonresidential loans increased by 4 basis points quarter over quarter to 0.33 percent and is 25 basis points higher than the pre-pandemic average.
Chart 11:
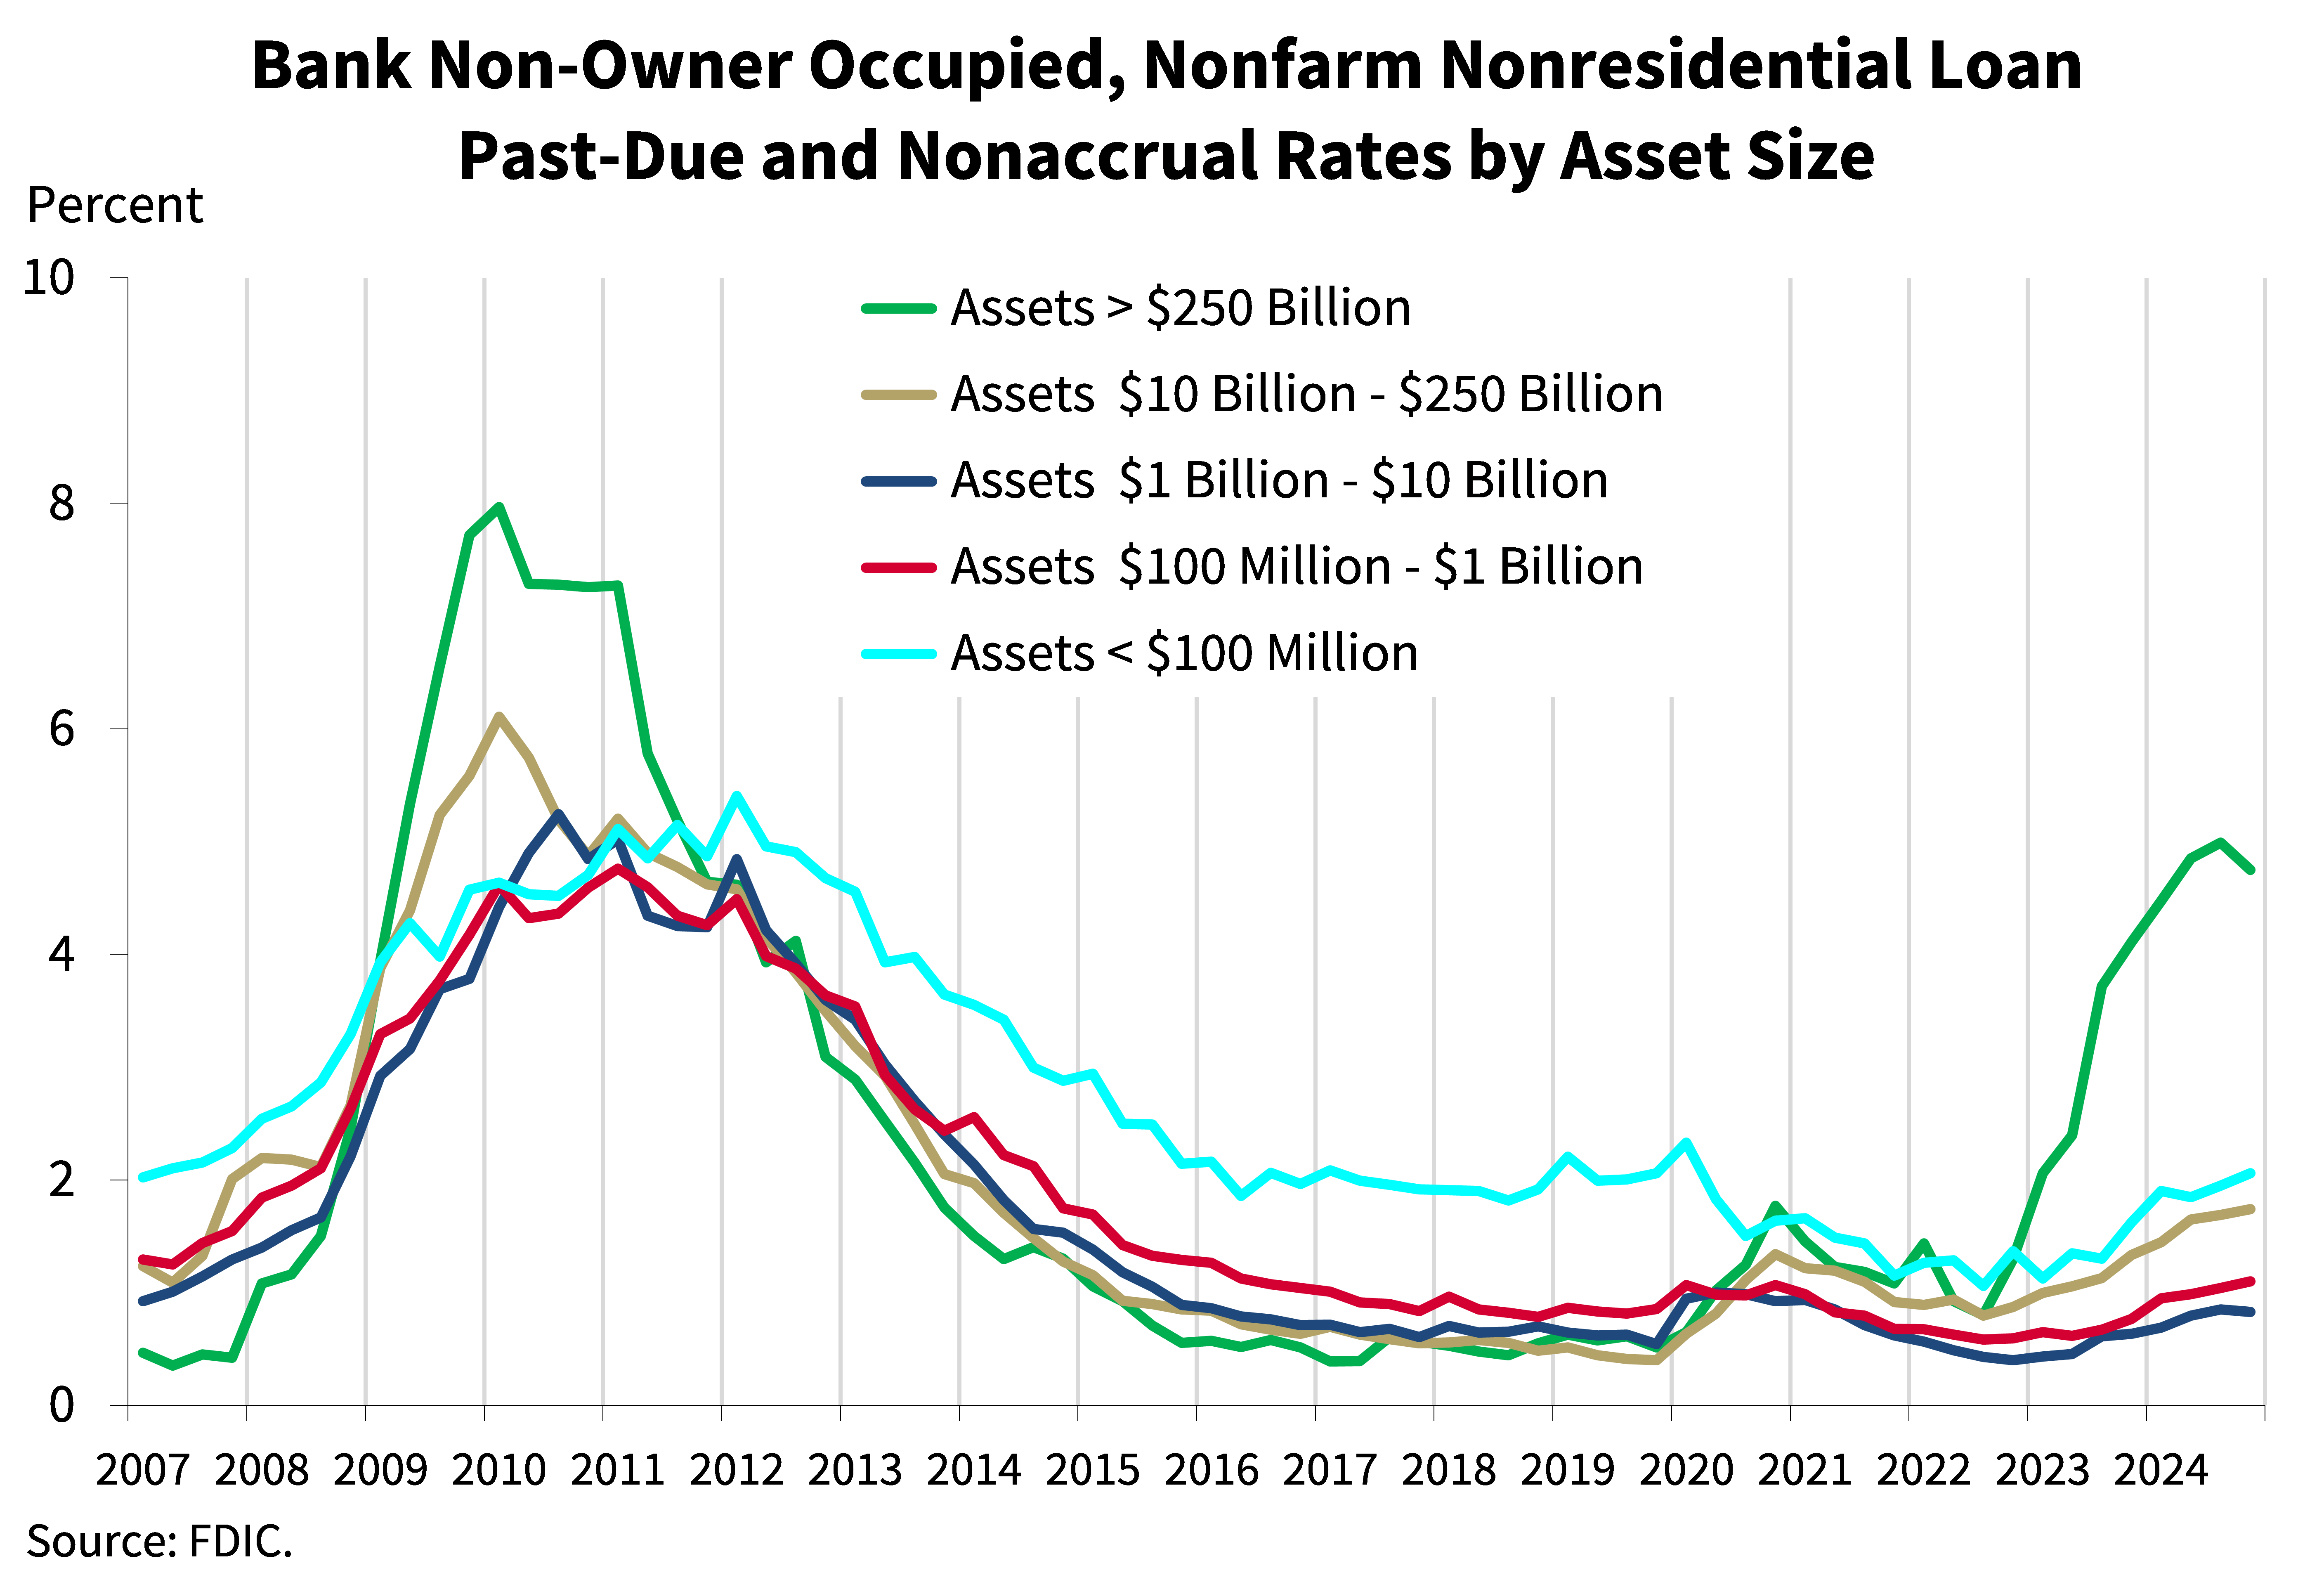
Looking deeper into the CRE portfolio, the elevated PDNA rates of non-owner-occupied property loans persisted in the fourth quarter, driven by the portfolios of the larger institutions. While the industry’s volume of PDNA non-owner-occupied CRE loans decreased $680 million, or 2.8 percent, quarter over quarter, the industry also reported increases in charge-offs for this portfolio.
As seen in this chart, the greatest weakness in non-owner-occupied CRE loans continued to be reported by the largest banks, or those with greater than $250 billion in assets. These banks reported a non-owner occupied CRE PDNA rate of 4.75 percent, down from 4.99 percent last quarter but well above their pre-pandemic average rate of 0.59 percent. However, these large banks tend to have lower concentrations of such loans in relation to total assets and capital than smaller institutions, mitigating the overall risk.
The next tier of banks, those with between $10 billion and $250 billion in assets, have greater concentrations in non-owner occupied CRE loans than the industry’s largest banks and reported a non-owner occupied PDNA rate of 1.74 percent in the fourth quarter, up from 1.69 percent in the third quarter and above its pre-pandemic average of 0.66 percent.
Banks in size cohorts below $10 billion in assets reported non-owner occupied PDNA ratios near their pre-pandemic averages.
Chart 12:
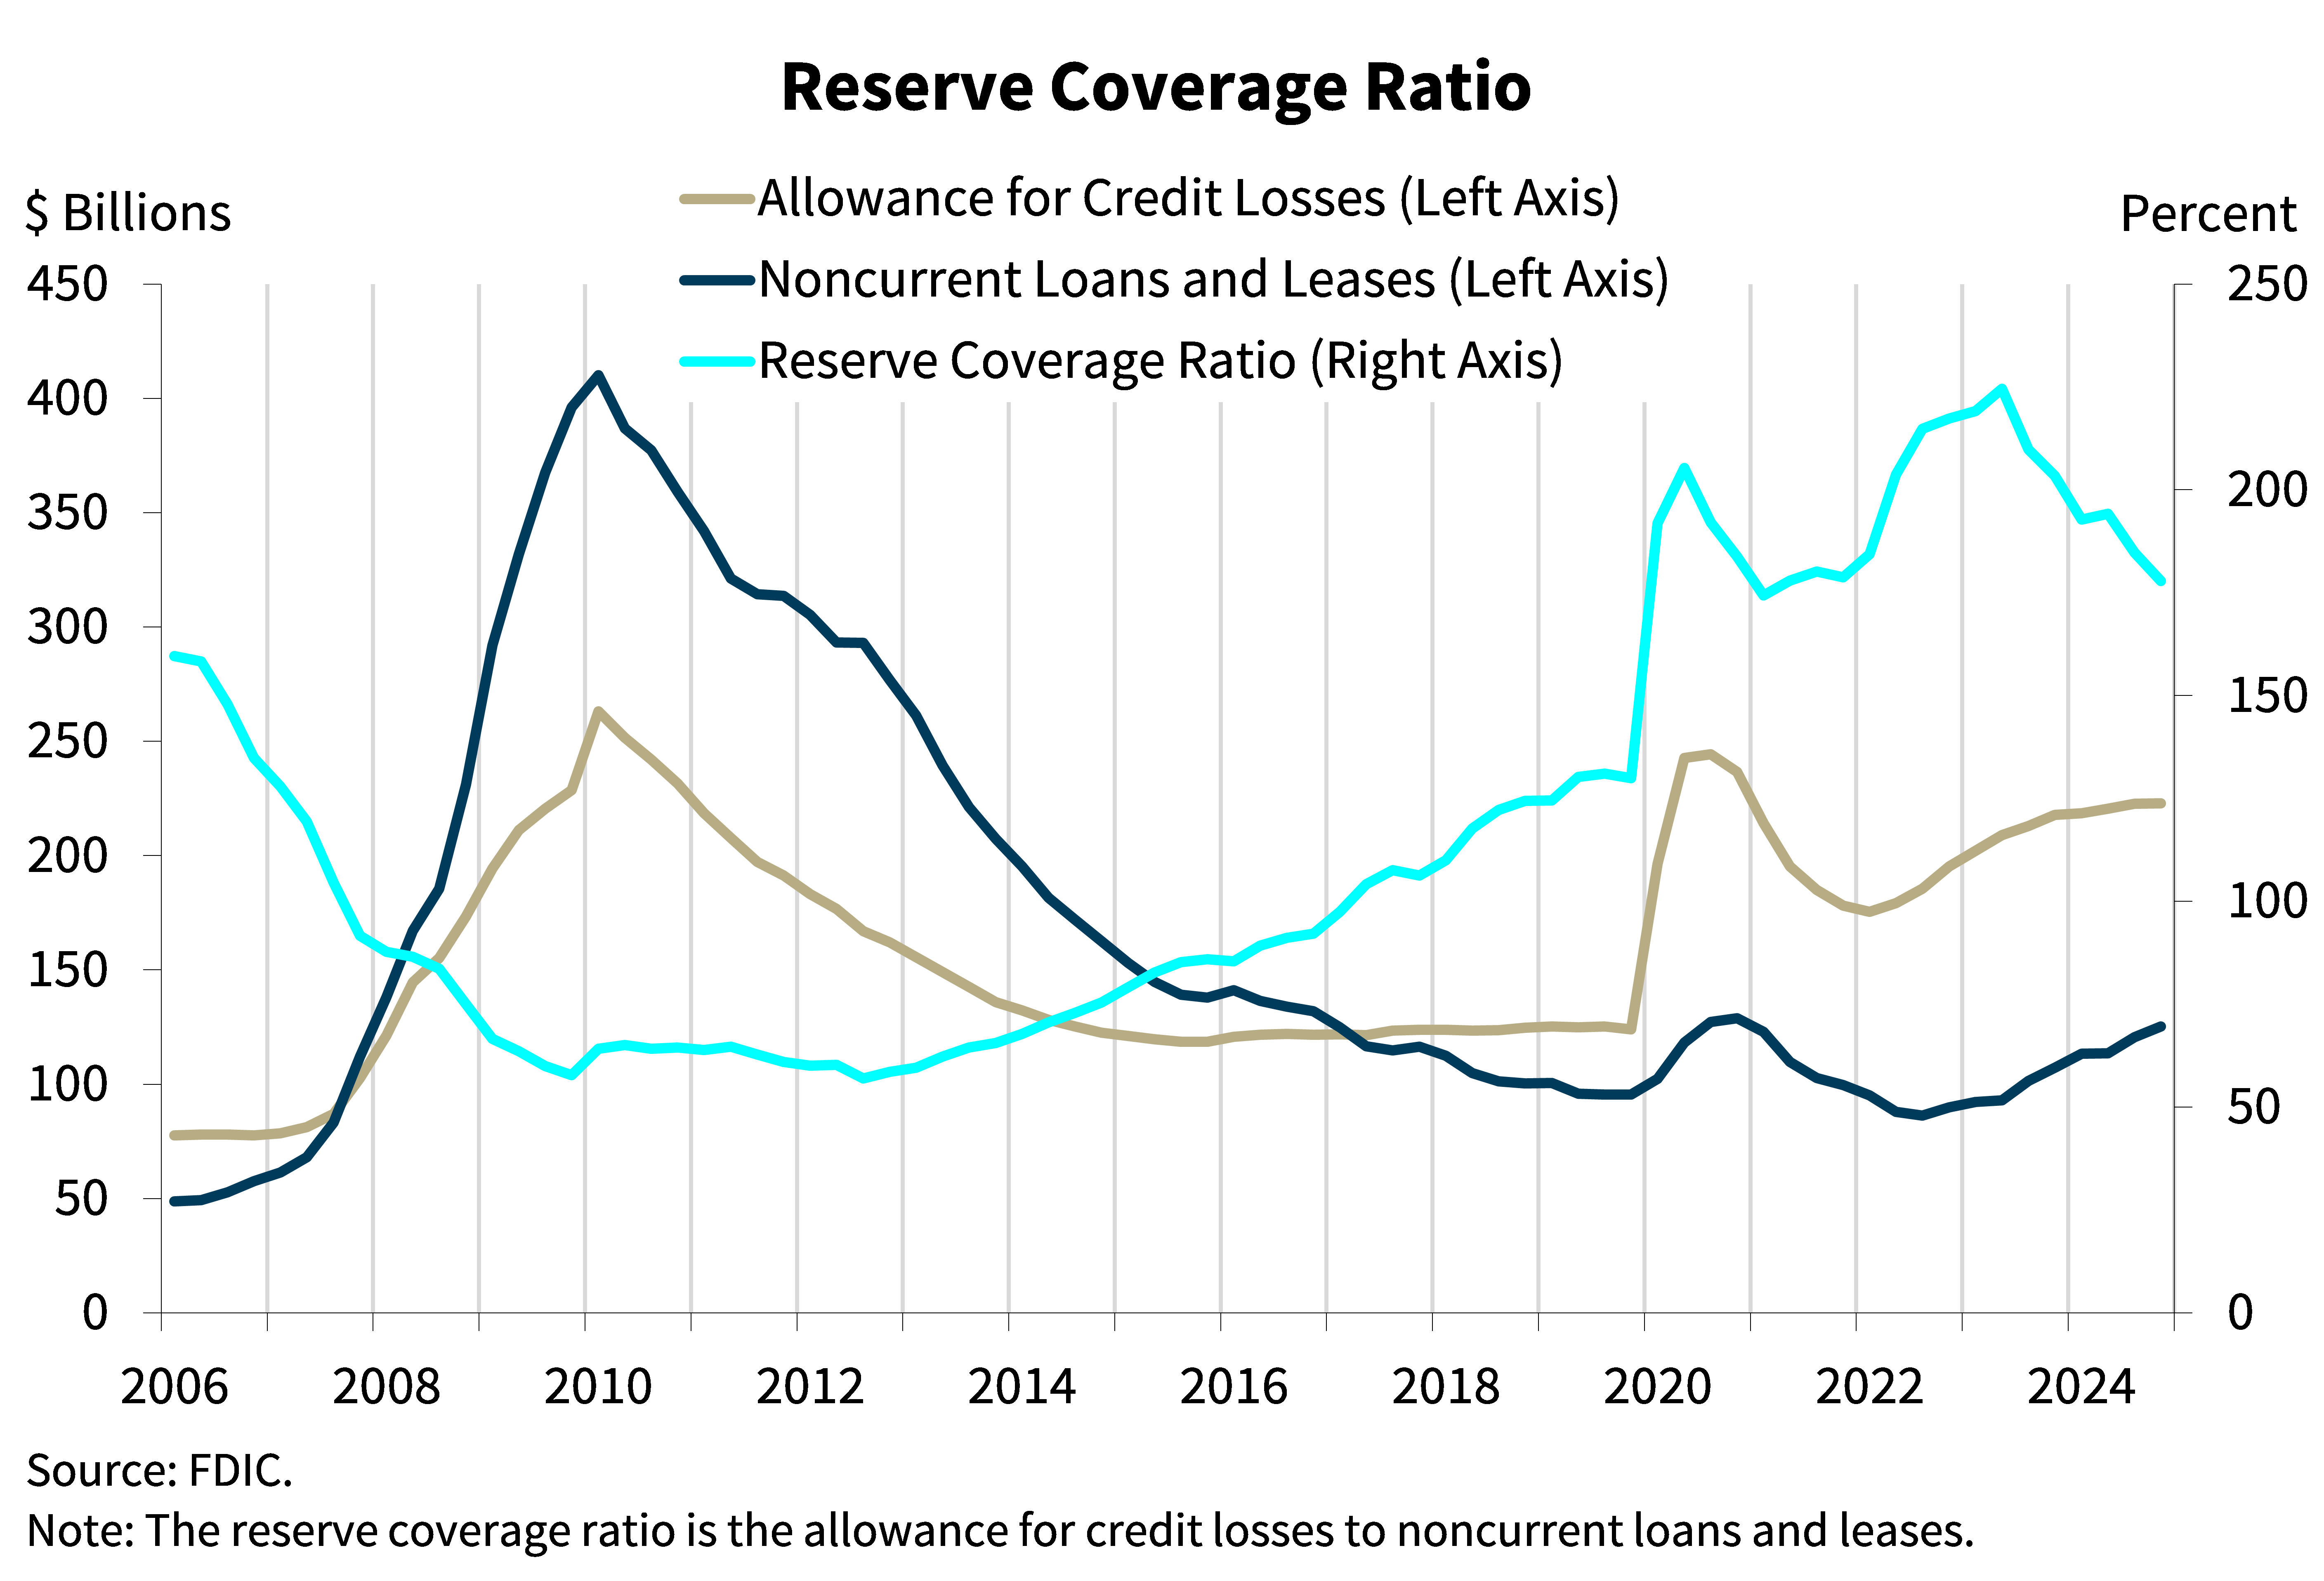
The next chart shows that the allowance for credit losses remained flat while noncurrent loan balances increased, resulting in a decrease in the reserve coverage ratio. The ratio of the allowance for credit losses to noncurrent loans decreased from 184.8 percent in the third quarter to 177.8 percent this quarter. This is still a much higher coverage ratio than the pre-pandemic average.
The reserve coverage ratio at community banks was 179.7 percent, down 6 percentage points quarter over quarter as noncurrent loan balances increased faster than the allowance for credit losses. Community banks’ pre-pandemic average reserve coverage ratio was 129.4 percent.
Chart 13:
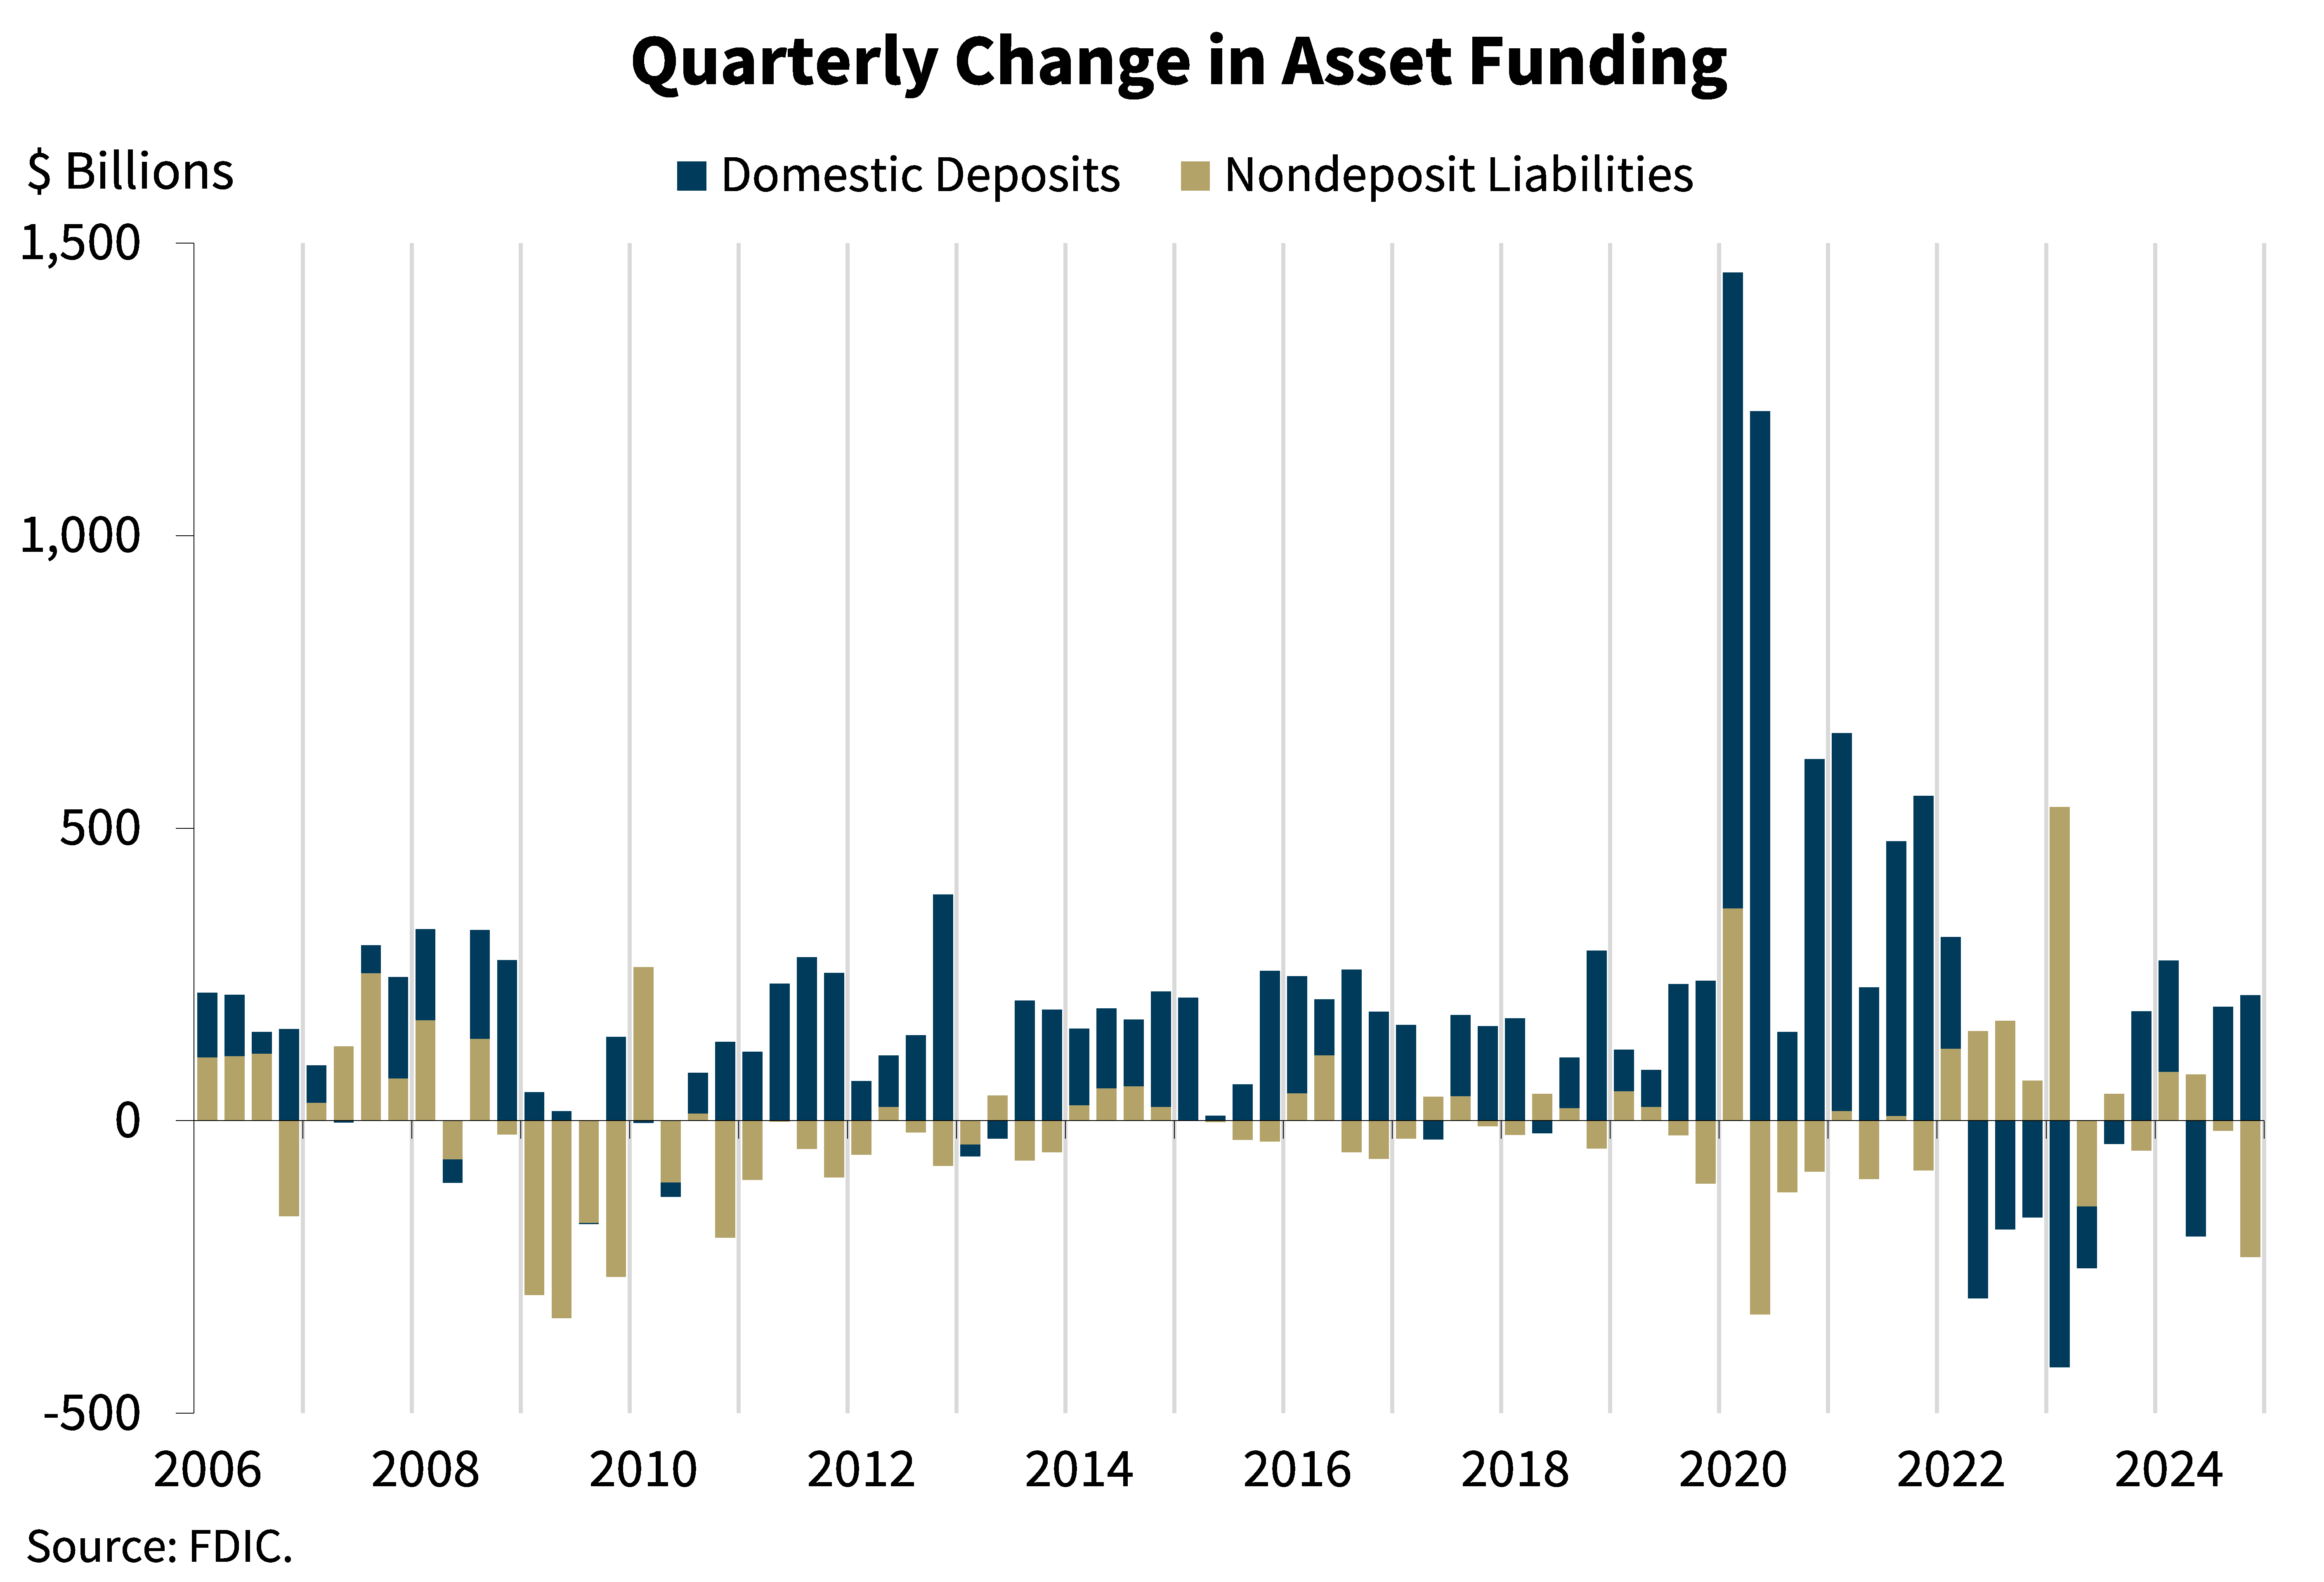
The next chart shows that domestic deposits increased $214.4 billion, or 1.2 percent, during the fourth quarter. Transaction deposits increased from the prior quarter by $230.7 billion while time deposits declined $122.4 billion. Brokered deposits decreased for the fourth straight quarter, down $46.0 billion (3.6 percent) from the prior quarter.
Estimated uninsured domestic deposits increased $218.5 billion, or 3.0 percent, during the quarter. Growth in estimated uninsured deposits was widespread; banks in all QBP asset size groups that report estimated uninsured deposits reported an increase in uninsured deposits from the previous quarter.
The industry’s insured deposits also increased, but at a slower pace. Insured deposits increased $39.1 billion quarter over quarter, or 0.4 percent.
The industry’s nondeposit liabilities decreased by $233.4 billion from the prior quarter, driven by a decrease in securities sold under agreement to repurchase.
Chart 14:
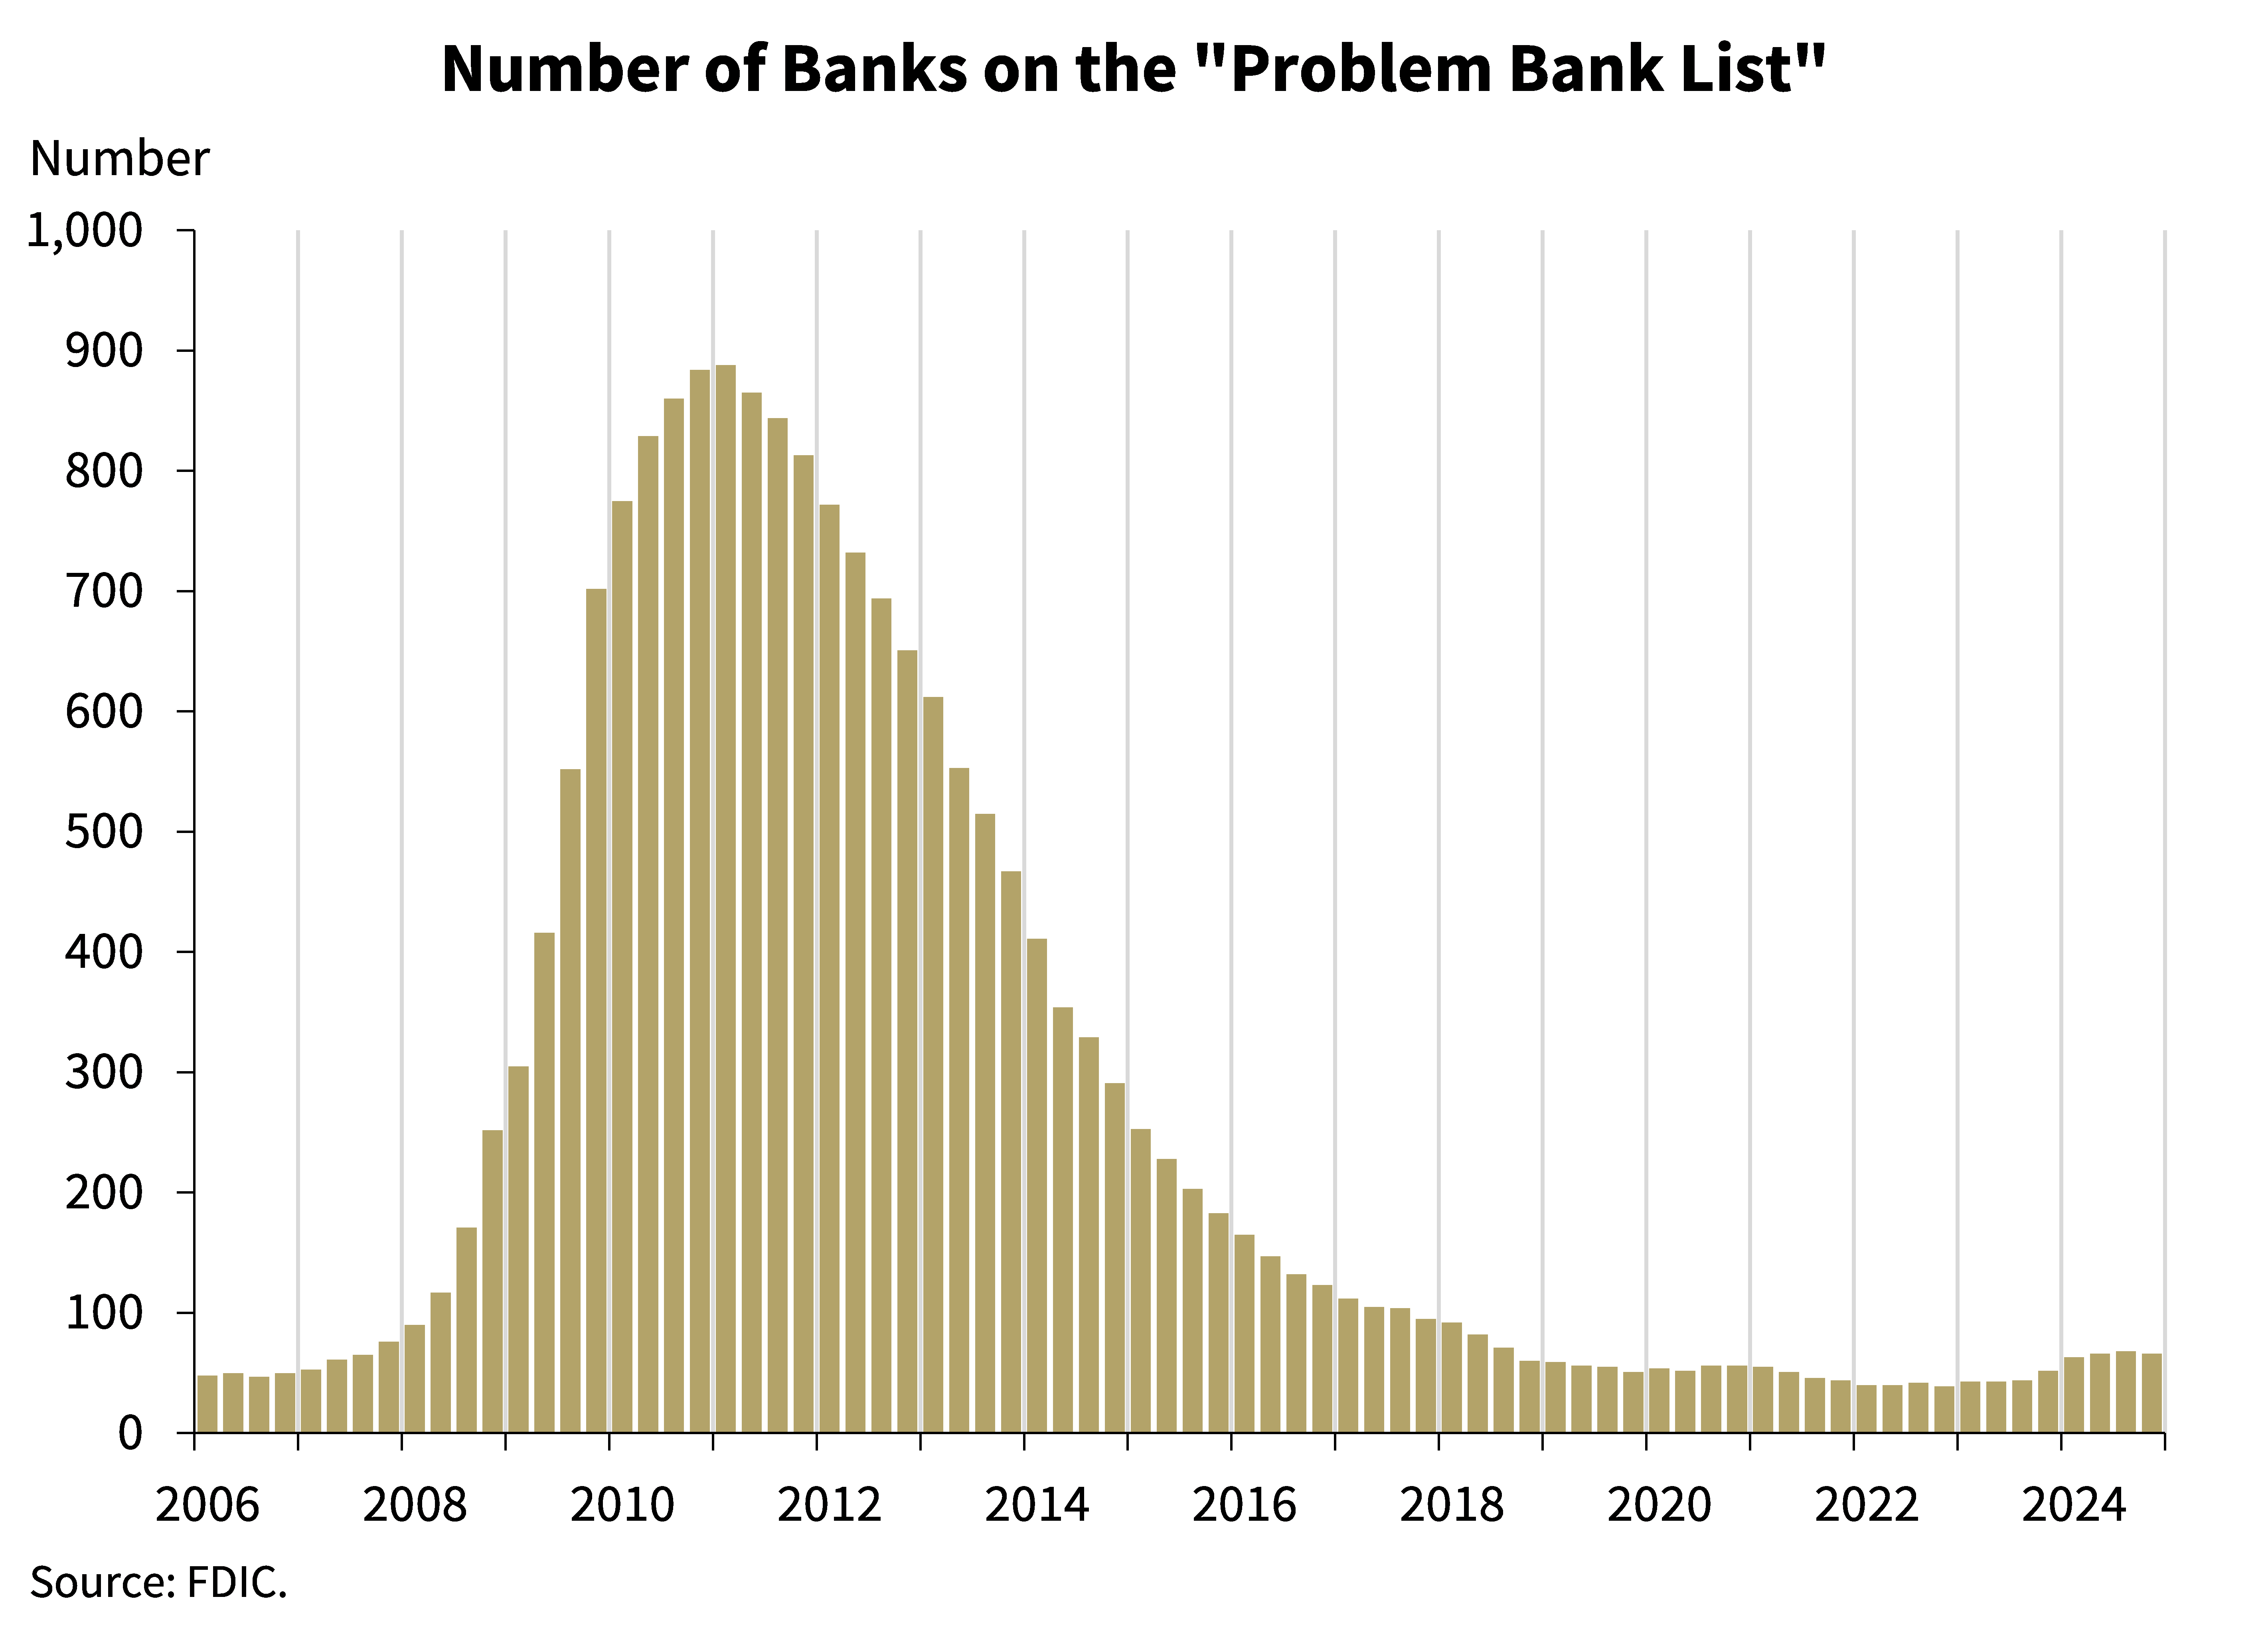
This chart shows the number of banks on the FDIC’s “Problem Bank List.” Banks on this list have a CAMELS composite rating of “4” or “5”. The number of banks on the list decreased by two in the fourth quarter to 66 banks. The number of problem banks represent 1.5 percent of total banks, which is in the middle of the normal range for non-crisis periods of 1 to 2 percent of all banks. One bank failed during the fourth quarter.
Chart 15:
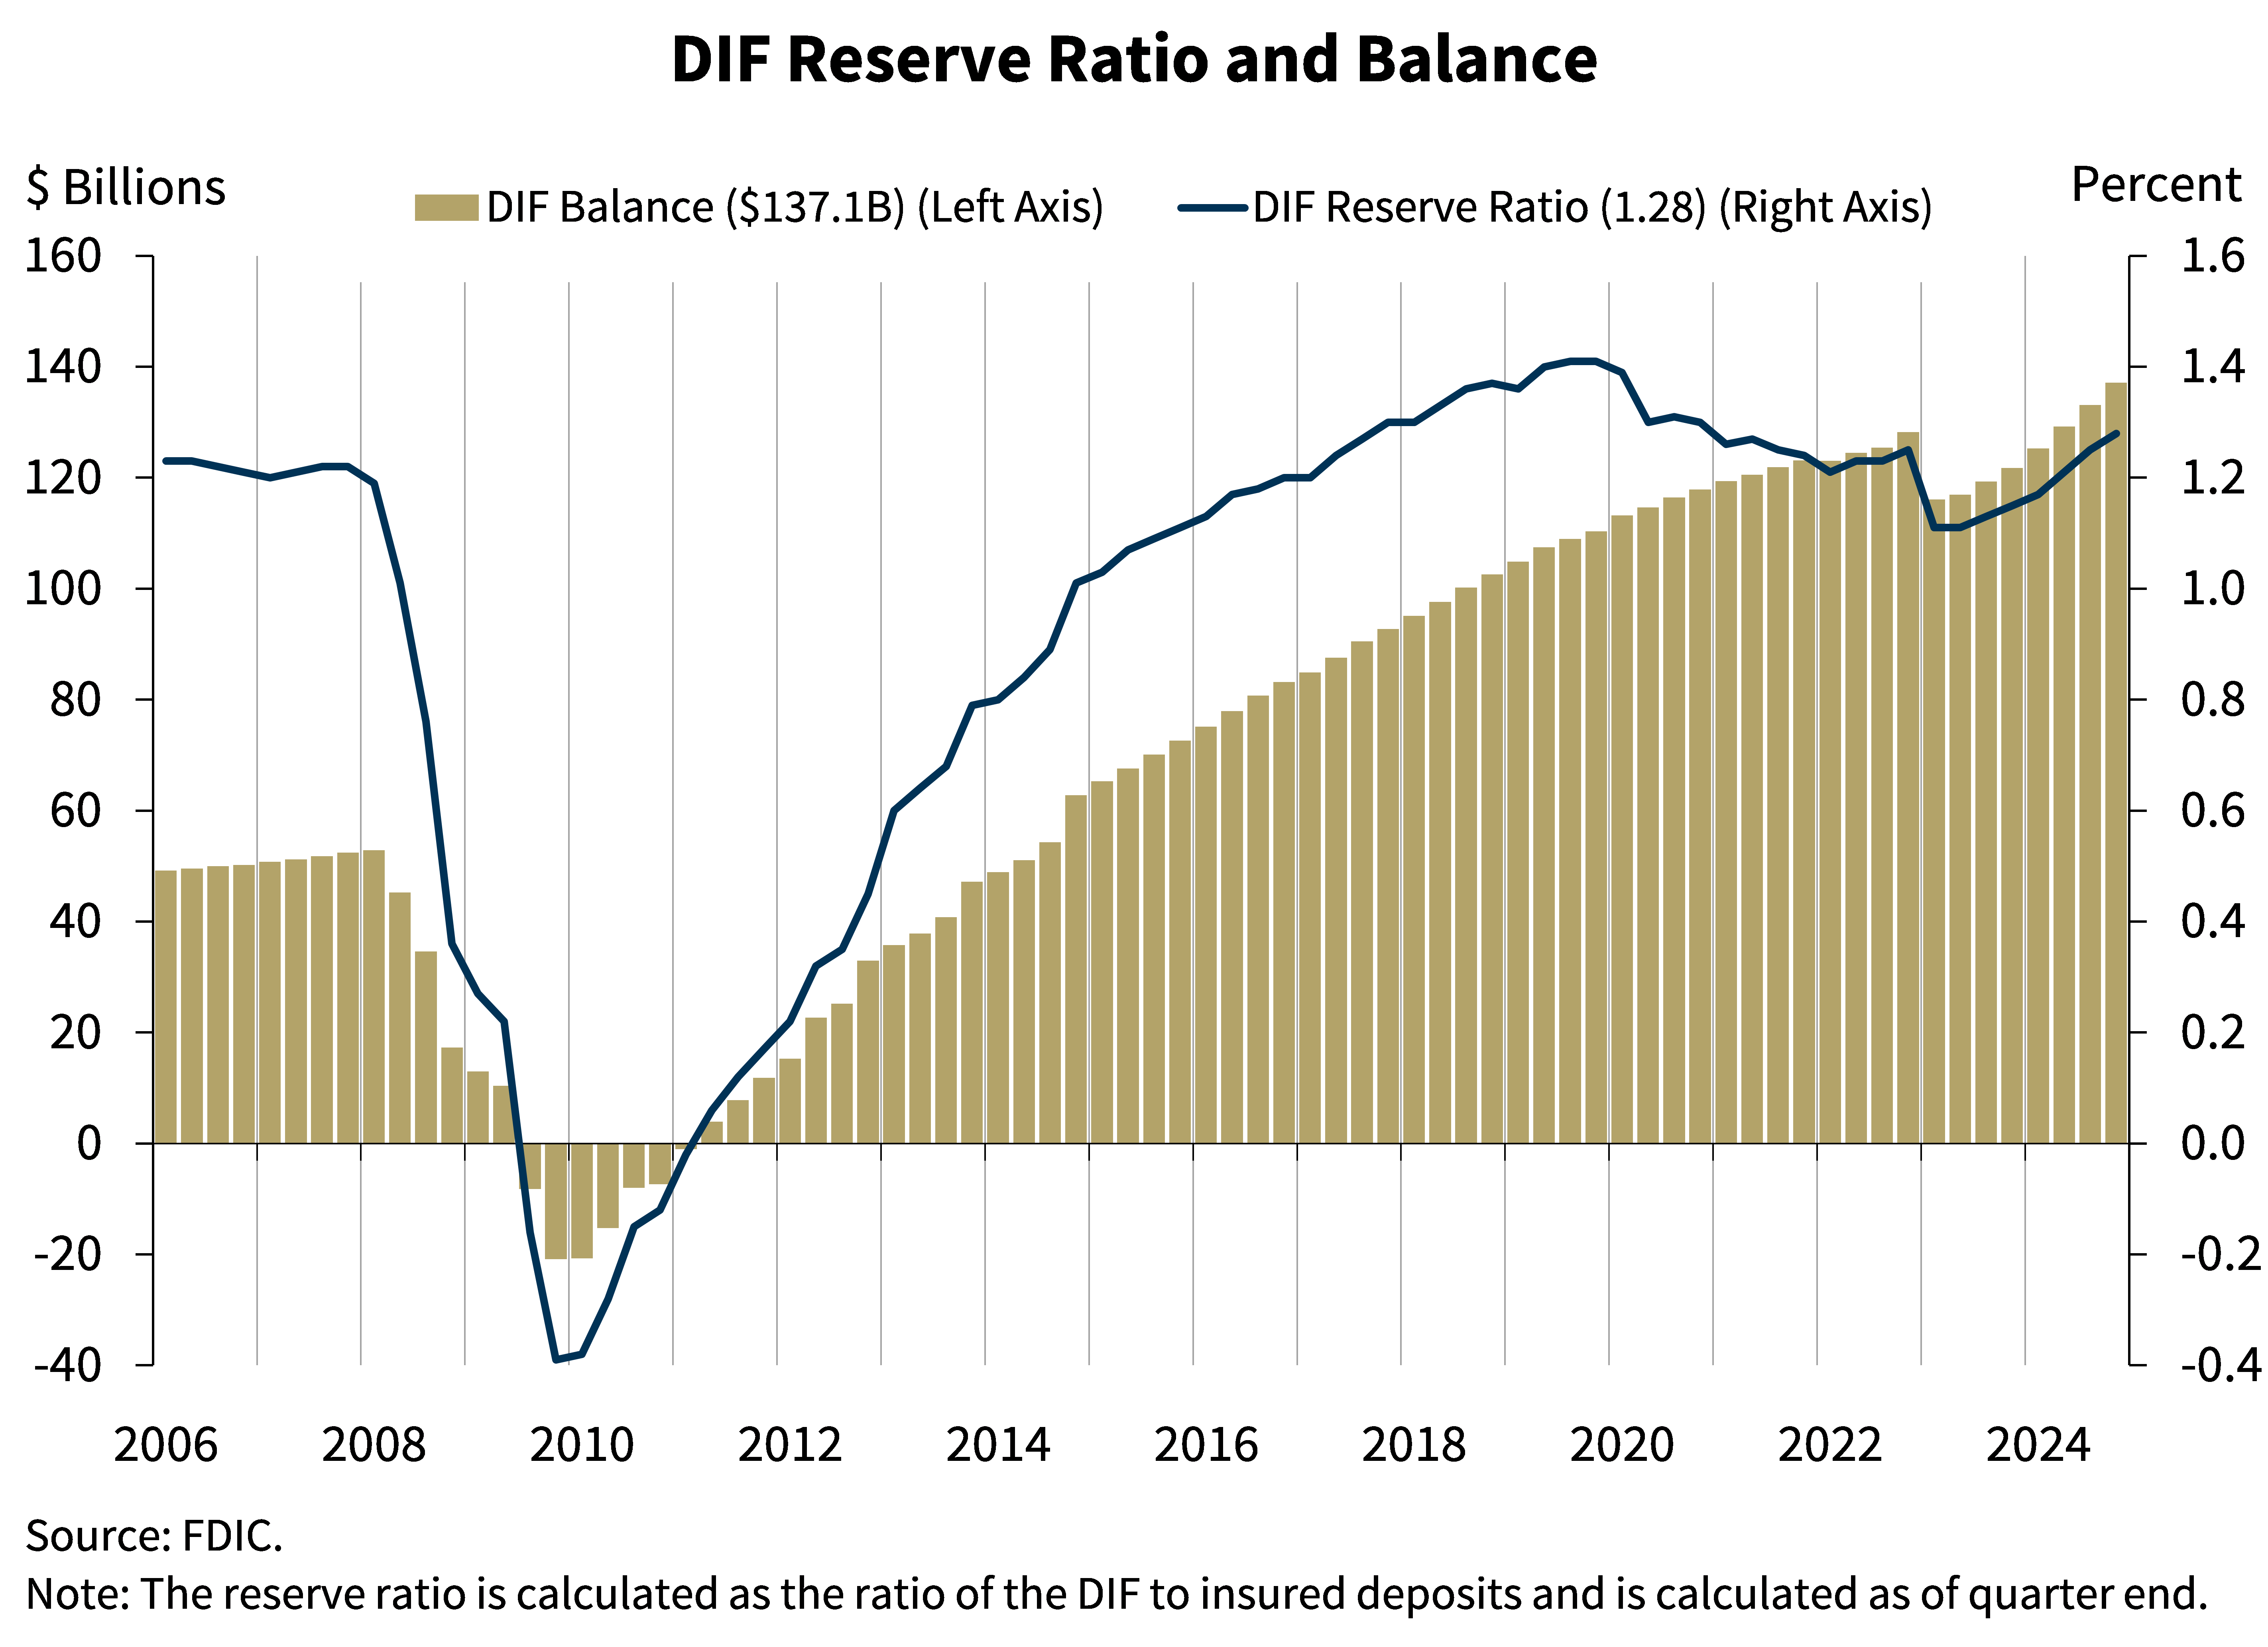
This chart shows that the DIF balance was $137.1 billion on December 31, 2024, up $4.0 billion from the third quarter.4 Assessment revenue continued to be the primary driver of the increase, adding $3.2 billion to the DIF balance. Interest earned on investment securities, negative provisions for insurance losses, and unrealized gains on securities also contributed a combined $1.5 billion to the fund, partially offset by operating expenses of $666 million.
Insured deposits increased approximately 0.4 percent during the fourth quarter, while year-over-year insured deposit growth was 0.5 percent. The reserve ratio increased by 3 basis points in the fourth quarter to 1.28 percent as of December 31, 2024, and was 13 basis points higher than a year ago.
The FDIC adopted a DIF Restoration Plan on September 15, 2020, to return the reserve ratio to the statutory minimum of 1.35 percent by September 30, 2028, as required by law. Based on FDIC projections, the reserve ratio remains on track to reach 1.35 percent by the statutory deadline. The FDIC will continue to monitor factors affecting the reserve ratio, including but not limited to, insured deposit growth and potential losses due to bank failures and related reserves.
| 1 | The “pre-pandemic average” in this statement is calculated as the average from first quarter 2015 through fourth quarter 2019. |
| 2 | This chart does not reflect unrealized gains or losses in other parts of the balance sheet. |
| 3 | In this statement, the terms “past-due and nonaccrual” or “PDNA” are used to describe loans that are 30 or more days past-due or on nonaccrual status. |
| 4 | The net change in the DIF balance does not include the cost of protecting uninsured depositors pursuant to the systemic risk determination made for the two bank failures that occurred in March 2023, as the FDIC is required by statute to recover those losses through a special assessment. As of December 31, 2024, the total loss estimate for Silicon Valley Bank and Signature Bank was $22.4 billion, of which $19.1 billion is attributable to the protection of uninsured depositors pursuant to the systemic risk determination and will be recovered through the special assessment. As with all receiverships, loss estimates will be periodically adjusted as the FDIC as receiver of failed banks sells assets, satisfies liabilities, and incurs receivership expenses. |